Buying and upgrading
What One Sophia’s Launch Reveals About Today’s Region Pricing Gaps
Published 2026-11-07. Adapted from the episode published 2025-07-15.

On this page
- Opening and Shifting Regional Price Equilibrium
- Regional Price Gaps and the Disparity Effect Framework
- Introductions and a Couple's Portfolio Growth
- Journey Mapping Toward Retirement and Balanced Portfolios
- Cooling Measures, Stability, and Disparity Gaps
- One Sophia Quantum Versus Nearby Resale
- Quantum, Location and Market Trends
- Ownership Stickiness, Interest Rates and the Commercial Case
- Commercial Property Benefits and Rental Data
- Decision Frameworks, Journey Maker, and Free Tools
- Buyer profiles, duties and holding power
- Comparing a home with an office investment
- Who might buy or rent here?
- Renter strength and what One Sophia offers a landlord
- Using frameworks to decide, and doing your own homework
Opening and Shifting Regional Price Equilibrium
I gave this talk at the One Sophia show gallery, where our property consultants were also available. The question I wanted to explore was how to compare the launch with the alternatives a buyer could actually choose.
When you walk into a developer launch, you assume whoever is on stage will only say good things about the project. So tonight I am leaning on charts, data and analysis, and on the PRB frameworks we have used for years to help investors decide.
The talk began with a question about how to judge launch prices. I wanted to compare what buyers were being asked to pay at a new launch with the resale choices they could make at the same budget.
In the talk I referred to sale-and-purchase agreements I said had been signed for recent launches. I used those examples to raise a question about what buyers were prepared to pay in the city fringe and suburbs.
Developer disclosures give some context for those launches. CDL's 2025 interim report records 668 of 777 units sold at The Orie's launch, and its January 2025 release gives a launch average of S$2,704 psf.
GuocoLand's FY2025 annual report records about 93% of 477 units taken up at the Lentor Central Residences launch weekend in March 2025. These are developer-reported launch results, separate from the figures I showed on my slides.
The natural reaction is to ask why not just buy resale. But resale does not look cheap either.
Sellers see how strong the market is and ask for future prices, not today's prices.
I used resale examples from different parts of Singapore to show the range of homes a buyer might compare. Lease age and the type of development matter when choosing those examples.
That raised a question for the talk: when you compare launch and resale, how much does the difference in price buy you?
Regional Price Gaps and the Disparity Effect Framework
When I started in real estate, I expected a fixed budget to buy more space as you moved farther from the core.
I call that a healthy regional disparity. Each region has different strengths, and the extra space can be part of what you gain by changing location.
In the talk I asked whether buyers were still getting that trade-off. Start with the same budget and look at what it buys across the core, city fringe and suburbs.
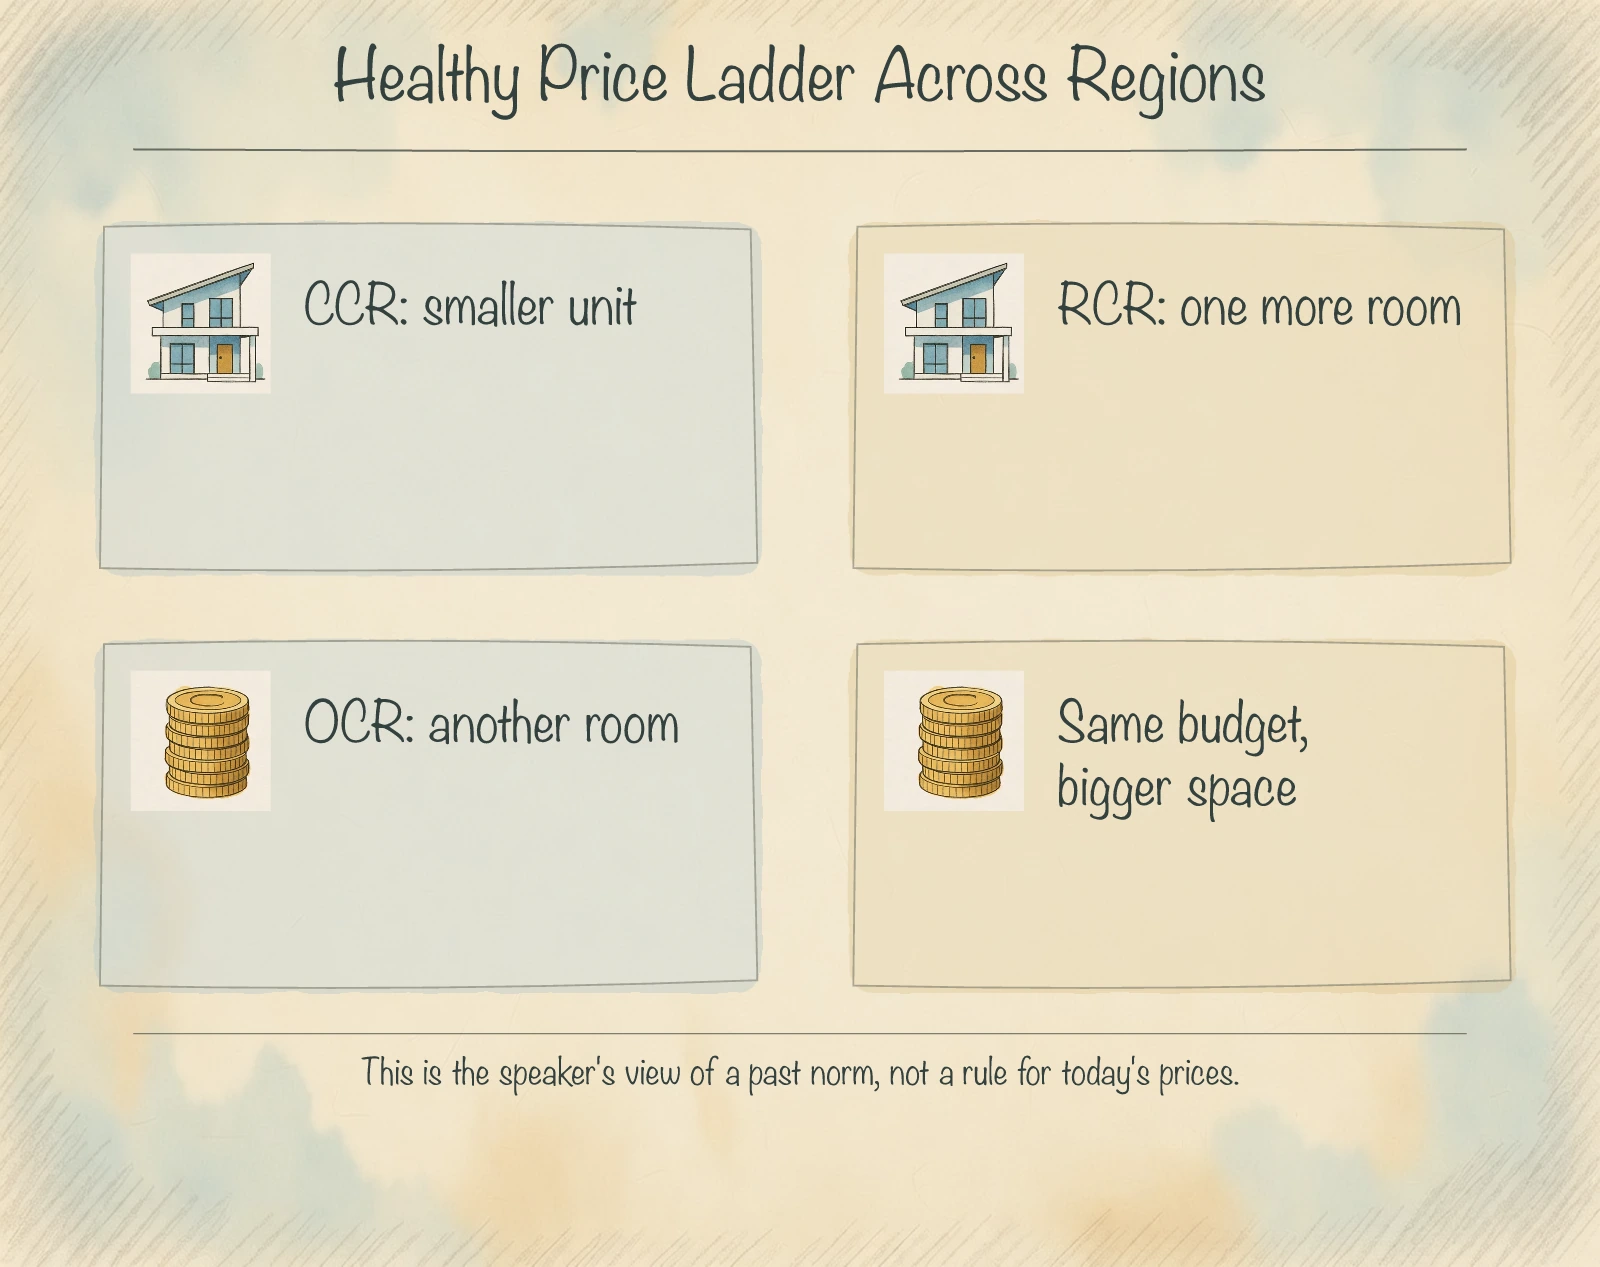
Each region has its own character. The OCR is the largest region, the HDB upgraders' playground.
Most Singaporeans start in HDB, and I did too. Upgrading near parents and children's schools feels natural and comfortable.
But familiarity is a bias. When we only look at the comfort of a place, we forget to look at pricing and the price differences between regions.
The city fringe and the core each attract buyers for different reasons. That is why I compare what a location offers alongside the total price.
I also look at how the civic district, traditional residential areas and the downtown core sit alongside one another.
Introductions and a Couple's Portfolio Growth
My favourite framework is the disparity effect framework. I will keep it simple, but it is practical.
First, though, let me show you the price index, which on its own does not tell you much.
A price index tracks price changes from a reference period. The presentation set each region’s index to 100 in the first quarter of 2009.
By the fourth quarter of 2024, the chart read 257.3 for the Outside Central Region, 203.4 for the Rest of Central Region and 154.8 for the Core Central Region. In my words on the day, the suburbs had risen by about 157%, the city fringe by about 103% and the core by about 54%.
The chart takes the first quarter of 2009 as its starting point.
The suburban and city fringe indices rose more from their own starting points than the core index did. I used that divergence to ask where a buyer should look next.
For a purchase, I compare what a fixed budget buys in each region. The regional index provides historical context for that exercise.
I also compare quantum, or the total purchase price, across locations.
The index tracks change from each region’s own starting point. Comparing prices for a purchase requires the sale prices and characteristics of the homes themselves.
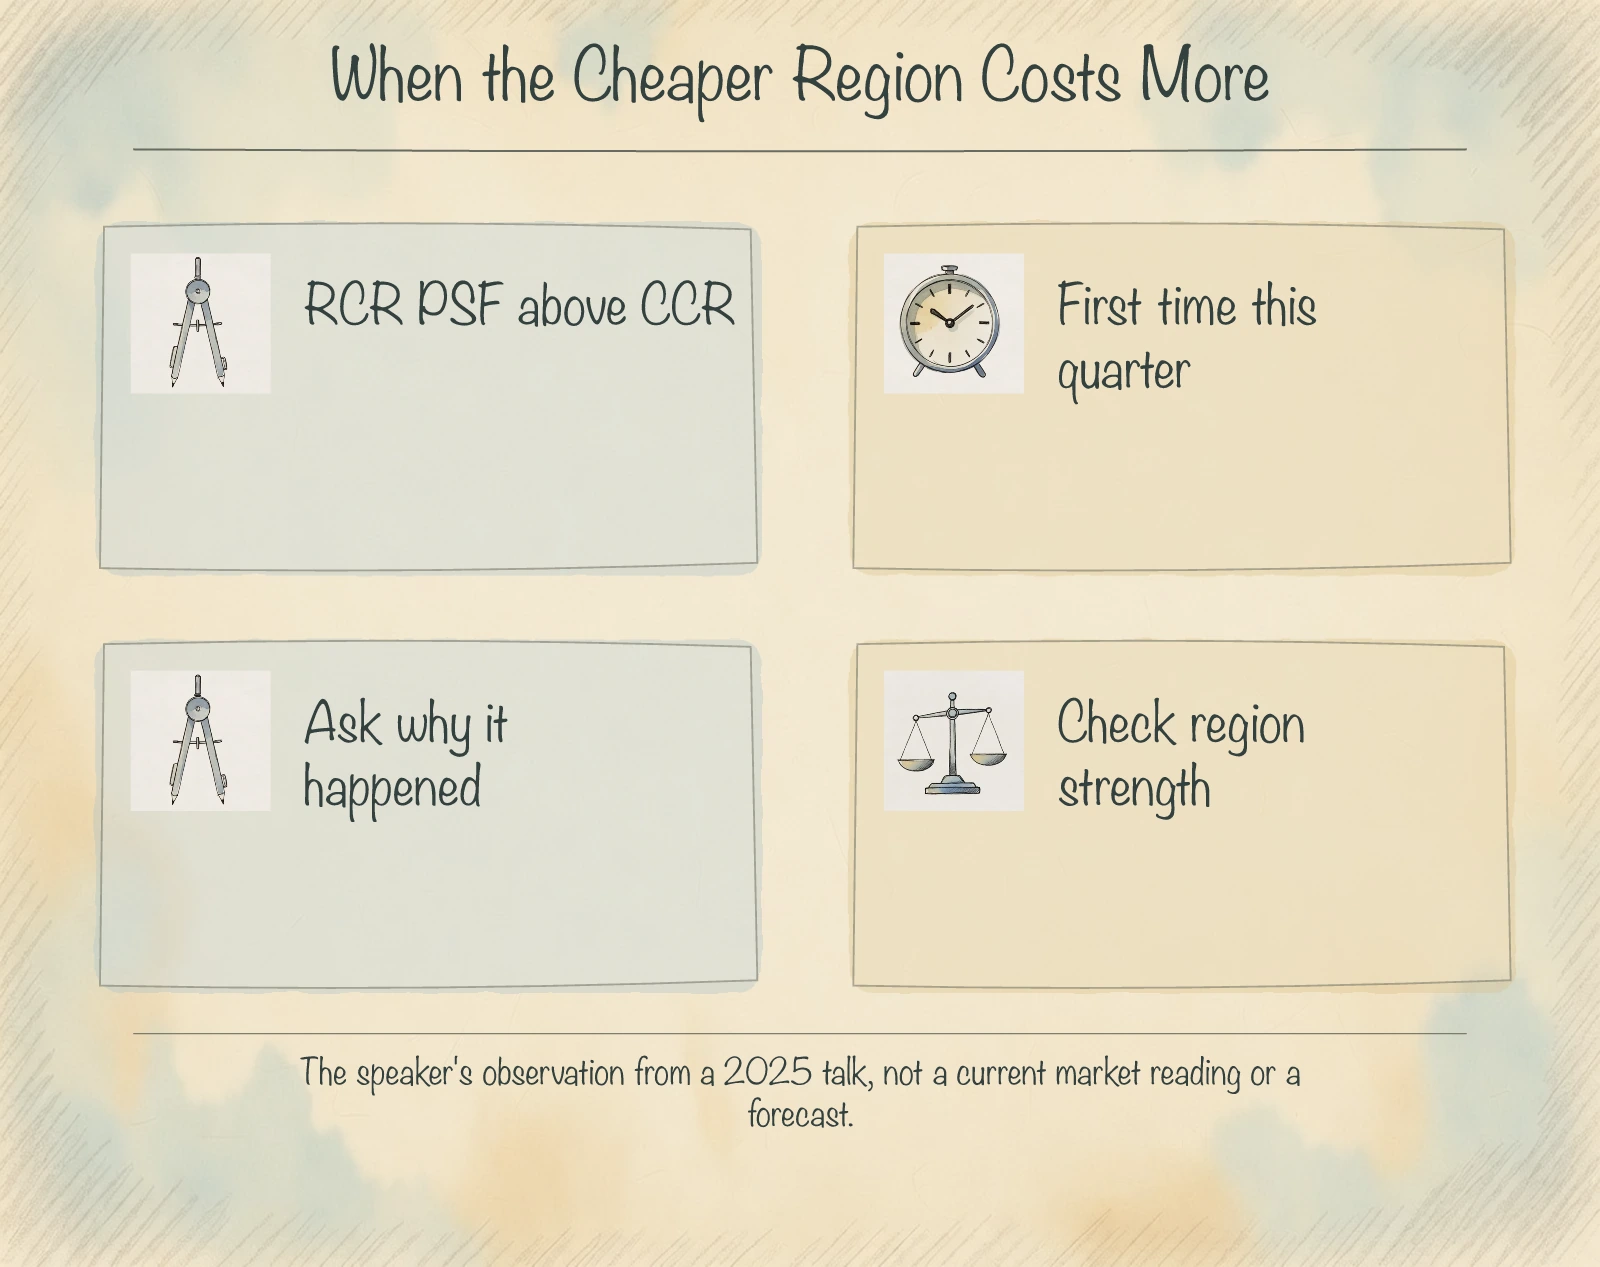
My observation at the talk was that the old trade-off between location and space did not always hold for the choices I was seeing. I also questioned whether resale was necessarily cheaper once I looked at sellers’ asking prices.
That was my starting hypothesis for the comparison. The later editorial check in the size and price section applies the method to two specific sales.
In the talk, Melvin questioned whether the traditional price hierarchy across regions was still a useful shortcut. He thought some city-fringe homes were getting close enough to core-region alternatives to justify reopening the search.
The question he posed was whether the same budget might buy a location he valued more. This was the speaker’s reading at the time.
The index tracks relative growth and does not establish those absolute price relationships.
Journey Mapping Toward Retirement and Balanced Portfolios
Before going deeper, consider what you need your property investment to achieve. A sale can take time and requires finding a buyer who can transact at your price.
Whatever the property, I say it must hit two objectives. It must have the potential to appreciate in value, and it must give you ease of exit.
Ease of exit means you should not buy something that takes two years to sell. By then you may have missed the opportunity for your next asset.
And if you hold a property for nine years while paying the mortgage, renting it out and managing it, and it does not appreciate, that is disappointing.
To check both objectives we use a structured approach. It runs from macro to micro to selection strategy, then the objective and exit plan.
After that we apply frameworks to decide whether a property is worth exploring. Tonight's framework is the disparity effect.
Cooling Measures, Stability, and Disparity Gaps
I shared a client couple’s journey. They started by selling their HDB flat and buying a condo.
Later we sold that condo and deployed their capital into two separate assets. Over five years they sold the HDB, bought a condo, sold it, bought another and then another.
The slide shows them owning a freehold and a 99-year-lease property, bought in 2024, the latter to rent out. The S$4.3 million shown on the slide is the combined gross value of the two properties, not profit or cash.
Why go through all that effort? The couple’s example was about deciding whether to stay in their existing flat or redeploy the equity from a sale.
Their time in the flat describes their own circumstances.
Their objective was clear from the start. They wanted properties with high growth and high rental speed, and they are following a simple formula to safeguard their future by buying the right type of property.
Their goal is also clear. By 55 they want the asset income to be big enough to turn into passive income.
I call this the property goal success formula.
Think of working income in our 20s to 50s as the riskiest one. I pointed to news of a local bank announcing retrenchments as an example of how uncontrollable events can hit anyone.
From the mid-50s onwards active income fades. If your assets are weak by then, your freedom is limited and retirement is under-funded.
It is a pity if the home you sleep in each night did not grow in value, because you can divest it later for retirement. In their case they did not spend the money they made from earlier properties.
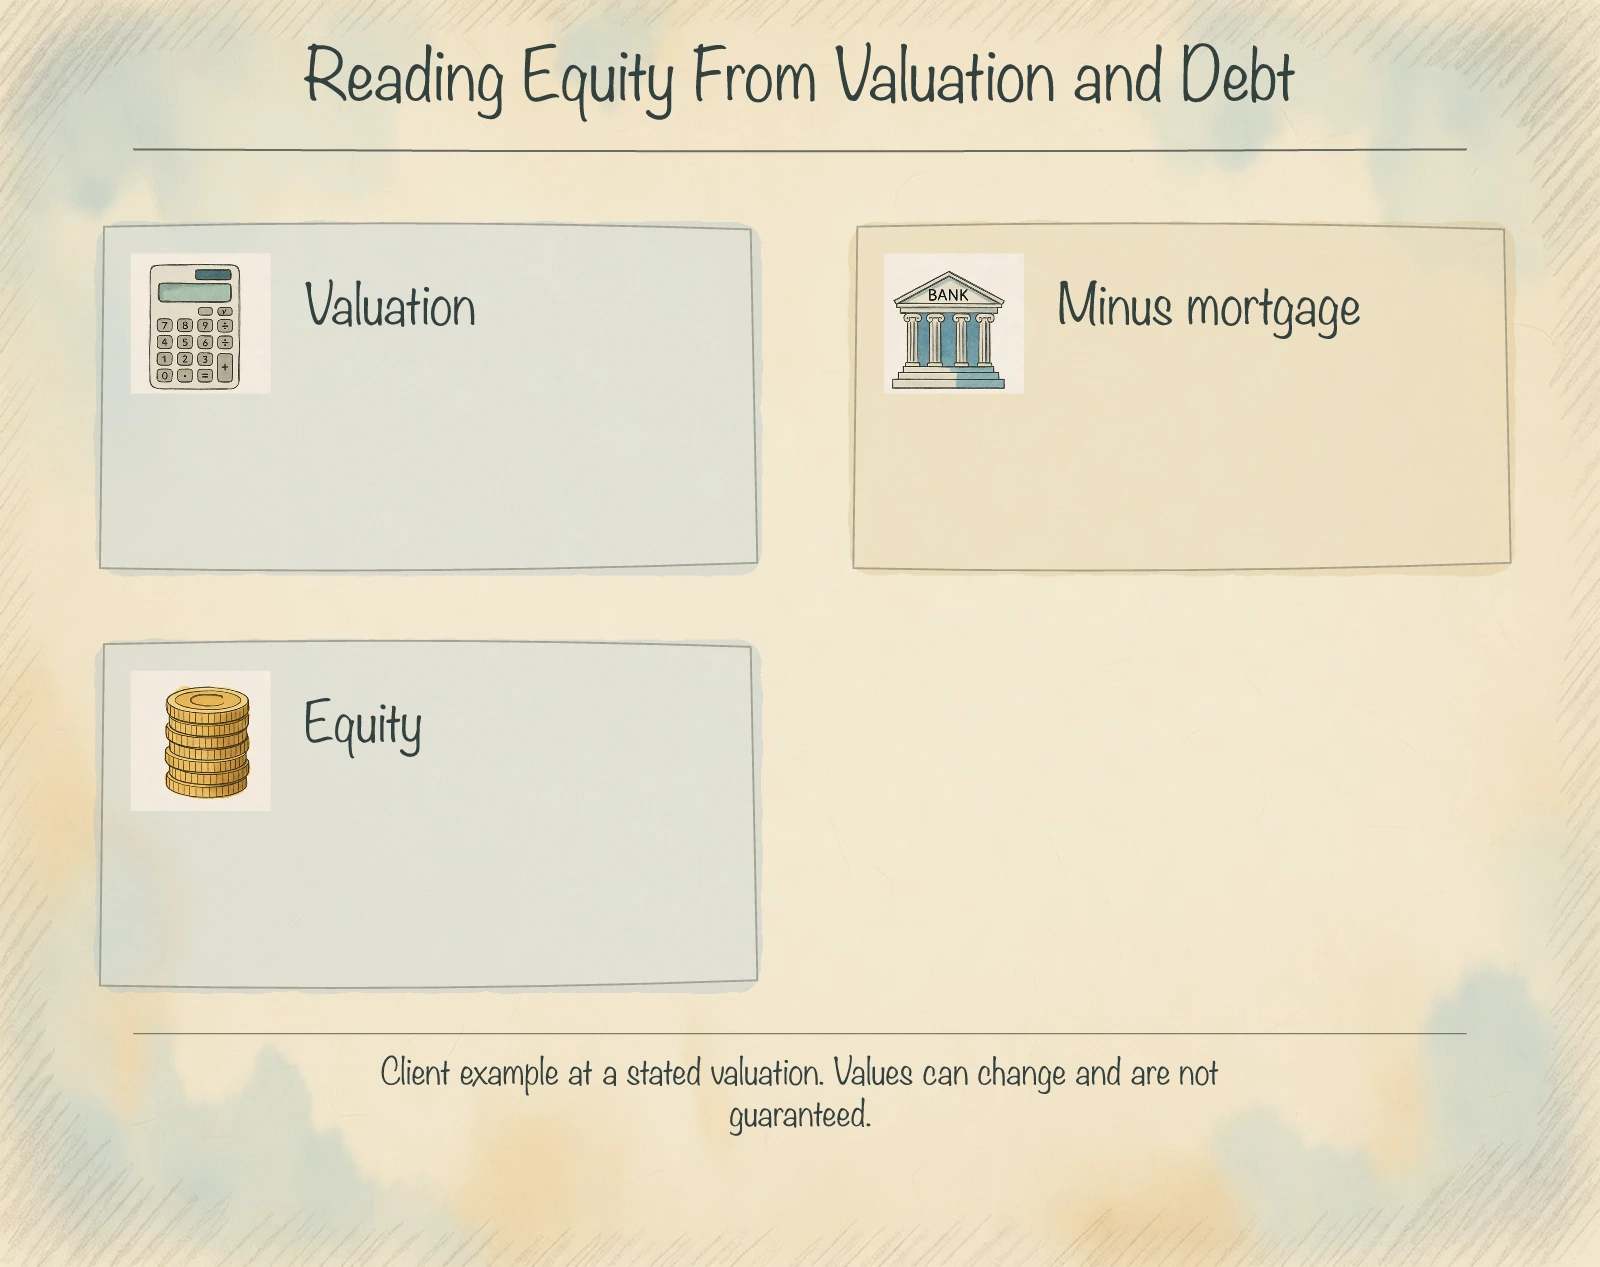
They redeployed all of it. The slide showed about S$3 million in mortgages against about S$1.3 million of equity.
Melvin illustrated the client plan with an assumed 2% annual increase, without compounding. The figure was an input in the illustration.
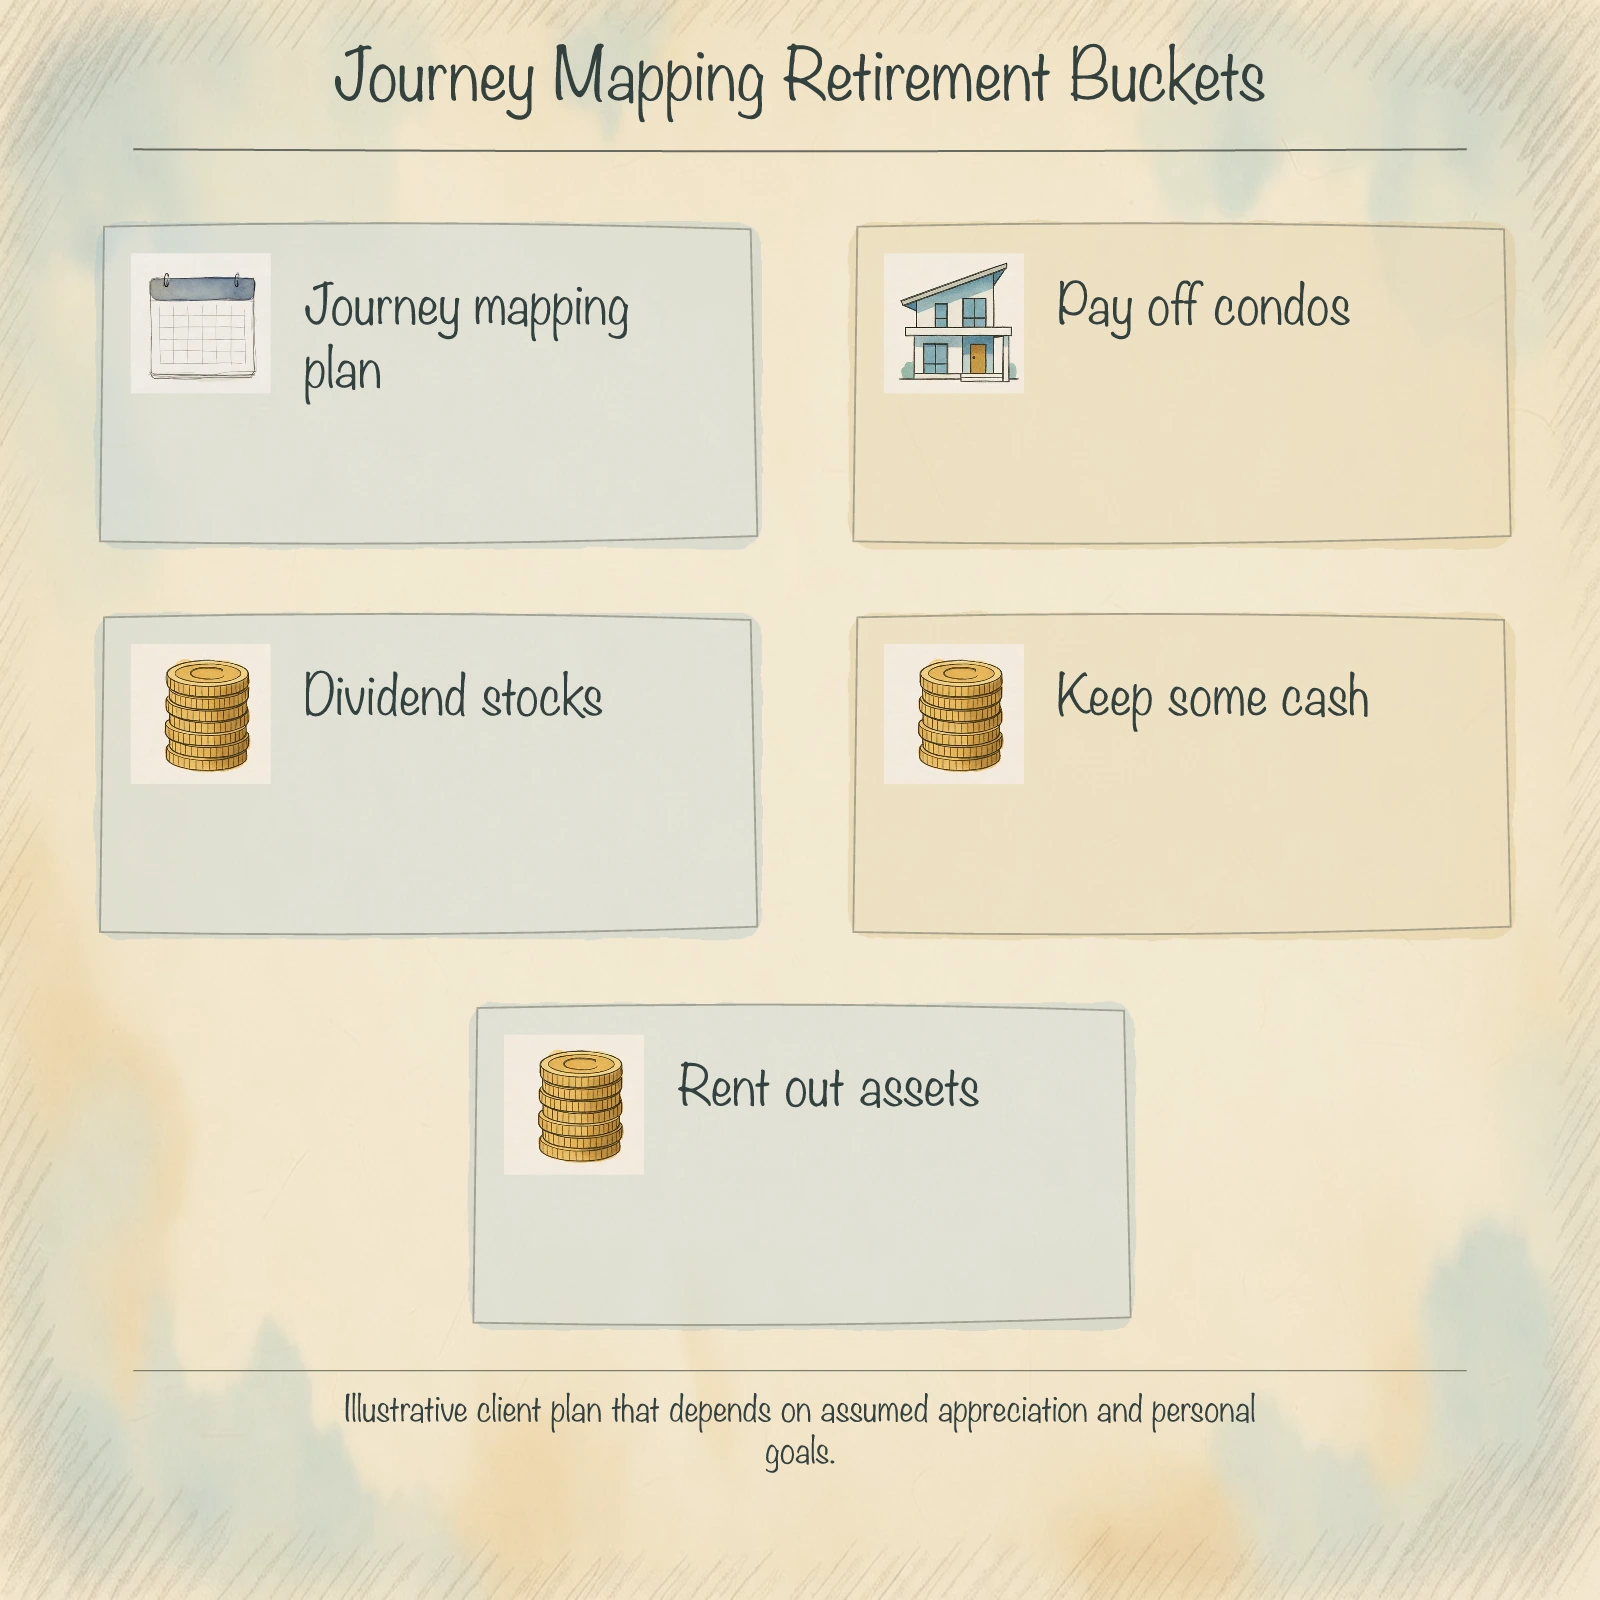
At 65, after the children have grown up, the plan I drew up deploys the proceeds into four buckets. They pay off a condo, pay off another condo and rent it out, hold dividend stocks and keep some cash.
They would still own two assets alongside passive income and liquid cash. We call this journey mapping.
If they want to enjoy the fruits earlier, at 55, the same logic applies. They sell, pay off the mortgage and deploy the remaining proceeds into three income buckets: a housing loan cleared, a renovated home, and dividend stocks plus liquid cash.
The purpose of investing in property is to enjoy the fruits of your labour, but you have to take action now to build the valuation.
Melvin said the couple wanted to place the proceeds in assets they saw as less volatile. He separately raised the value of a balanced portfolio.
Once a couple like this has completed their residential investments, they have further choices. They can set up an investment holding company and take a loan, perhaps with friends or with parents who have spare funds.
Or they can look at an office or commercial unit.
One Sophia Quantum Versus Nearby Resale
I use the disparity effect framework to compare how prices for similar properties move over time.
It has to do with an equilibrium state. Imagine two properties, A and B, side by side with a certain price disparity between them.
In a normal market, both would inflate together, because a seller will not sell lower than the last transaction and prices drift up gradually.
Sometimes A moves differently. By right it should have risen to a certain price, but it moved less.
That is a disparity gap. This is the time to take note and take action.
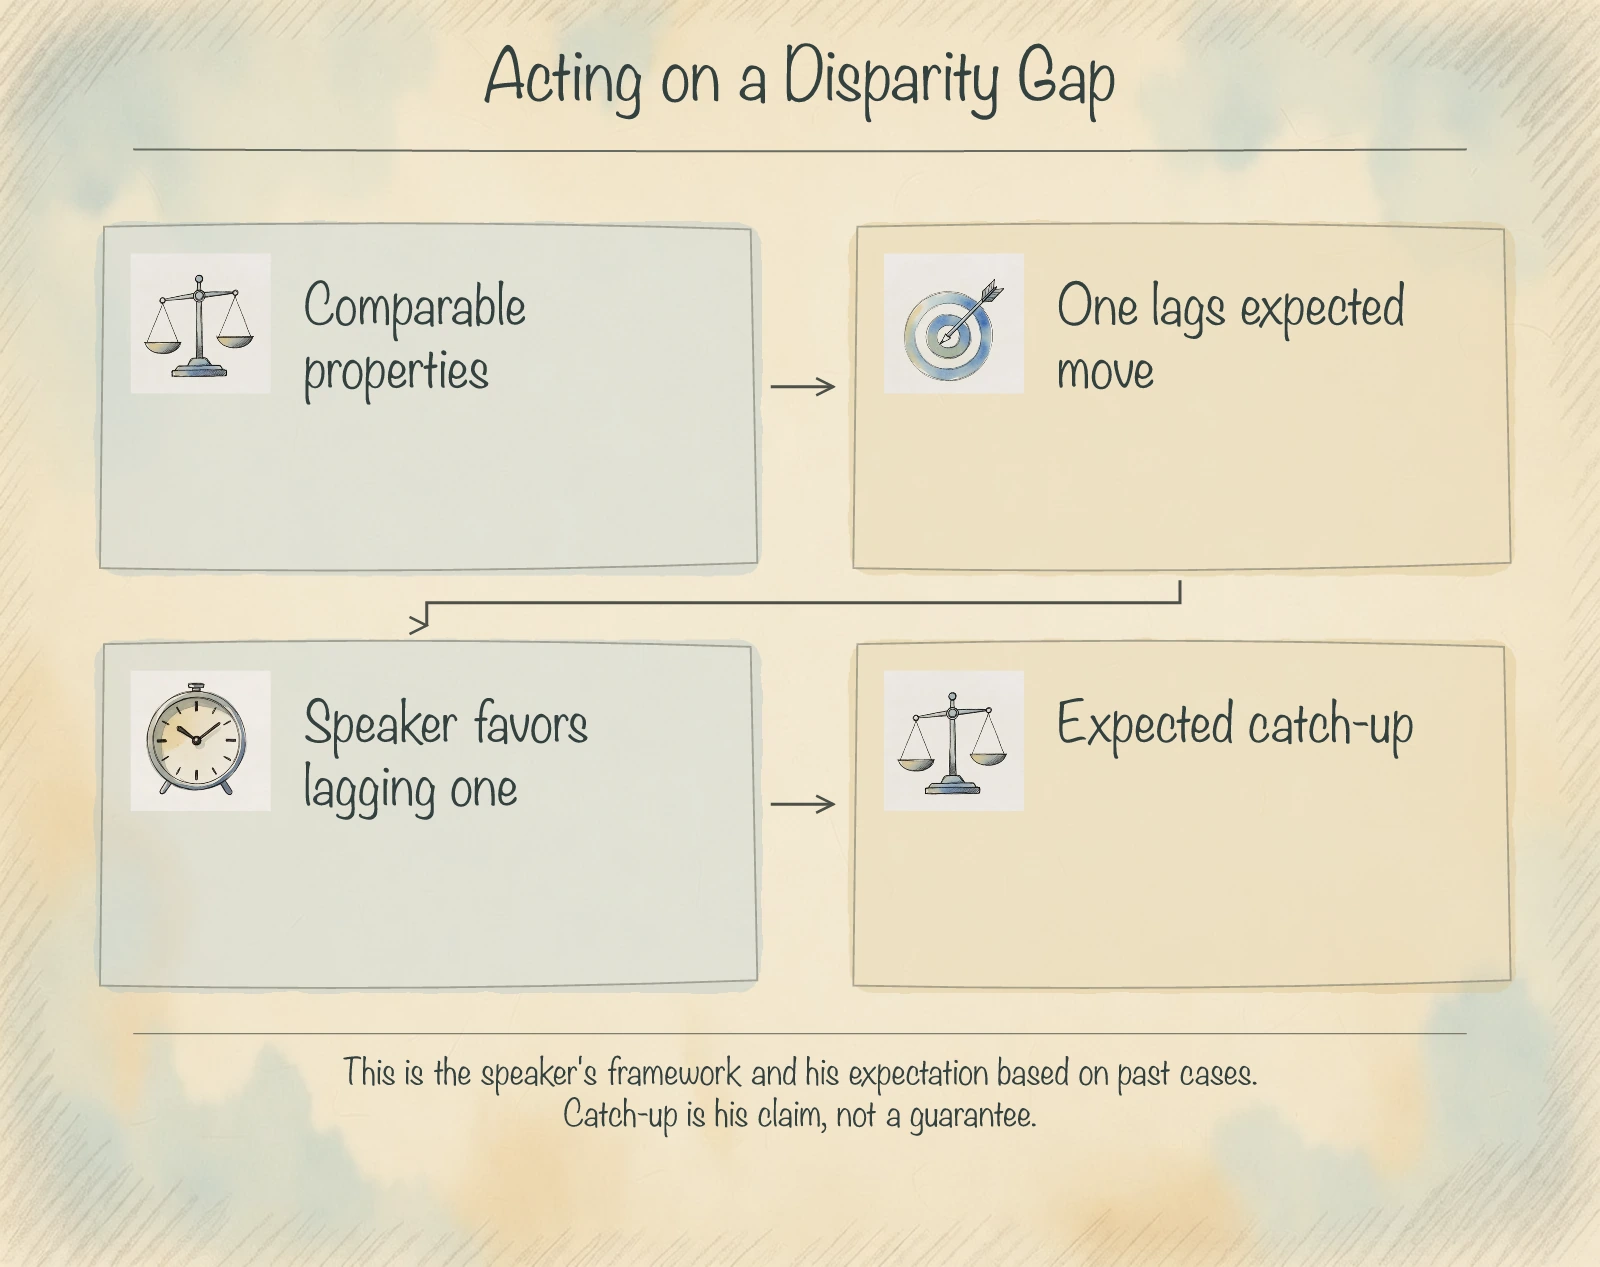
My thesis in the talk was that a catalyst could help the lagging property close some of the gap. That was the property I wanted to examine.
Melvin calls this a catalyst push. In applying the idea, compare the homes’ differences as well as the prices.
A price gap can persist when buyers value those differences.
I gave four things to use for decisions. First, size and quantum opportunity, together with the opportunity of a fresh 99-year lease.
Second, region disparity. Third, new launch catalyst disparity.
Fourth, location disparity.
Quantum, Location and Market Trends
Sometimes resale is better than a new launch, and sometimes the opposite holds. Someone considering The Collective at One Sophia may also wonder about resale around Sophia Hills.
That is exactly the right comparison to make.
I gave a past example from a client couple we have journeyed with for fifteen years. After COVID we asked them to go for a 20-year-old resale rather than another option, because there was a gap at that time.
The gap is gone now, and I would no longer say the same.
In the case shown on my slide, the couple bought a Rio Vista penthouse for S$1.565 million in October 2020 and sold it for S$2.42 million in July 2024.
That is a gross difference of about S$855,000 before costs, drawn from my own slide. It is a client case and does not separate the catalyst from the wider market's movement over those years.
My point was that the gap I saw then has since closed. A later buyer would have to make the comparison again.
In another comparison the new launch may make more sense. In Sophia, I compared resale asking prices and the total price of the new launch alongside the size and lease of the homes.
Melvin pointed to older District 9 homes with larger floor plates. When comparing two homes, a lower price per square foot can still mean a higher total price if the home is larger.
Supply is another part of the comparison. Look at what has launched in the area and what buyers can choose from.
A separate editorial check after the talk, conducted on 7 November 2026, used URA’s April to September 2025 apartment and condominium sales. The search found nine new sales at The Collective and 14 resales at Sophia Hills.
It also searched Haus on Handy as a nearby comparison and returned no rows for that project.
Screening for single-unit strata sales on 99-year leases in the same or adjacent contract months, with floor areas within 10% of the smaller unit and the same floor band, produced no matches. Relaxing only the floor-band condition and taking the closest floor areas gives one illustration.
In April 2025, a 548.96 sq ft new sale at The Collective sold for S$1.492 million (S$2,718 psf, floors 01–05). In May 2025, a 570.49 sq ft Sophia Hills resale sold for S$1.28 million (S$2,244 psf, floors 06–10).
In that pair the new sale cost S$212,000 more for about 22 sq ft less, on leases that began in 2023 and 2013. The records do not show bedroom counts, views, layout or condition, and other pairs would give different gaps.
The pair shows how a comparison is built. It does not show a project-wide premium or test the speaker's observations.
I also compared supply across locations. In the talk I pointed to executive condominium and government land releases in suburban areas and contrasted that with what I saw as fewer opportunities for new supply in District 9.
My point was to check the pipeline alongside existing resale choices.
Ownership Stickiness, Interest Rates and the Commercial Case
When I look across regions, I ask what each location offers at the same budget.
If two homes cost about the same, the trade-off is in what you get for that price, including space and how the location fits your needs.
When I compare locations, I look at how a resident actually gets to transport and daily amenities.
SingHaiyi lists One Sophia and The Collective at One Sophia as a 99-year leasehold mixed-use development at 1 Sophia Road. Its project page lists 367 apartments, 122 strata offices and 127 strata commercial units.
Melvin distinguished the convenience he associates with a direct transport connection from the convenience of having homes, offices and shops in a mixed-use development. In his comparison, the question was how residents would actually use those connections and amenities.
Commercial Property Benefits and Rental Data
The third disparity is the new launch catalyst disparity. It answers the question of whether to go for something freehold around this zone, perhaps near Sophia Hill.
Many boutique developments around here are freehold, so it is a natural question.
In the talk, Melvin recalled nearby resale owners raising asking prices after Emerald of Katong launched. He used the example to explain how a new launch might change sellers’ expectations.
Melvin’s view was that higher accepted resale prices could change the area’s price benchmark. His example described asking prices.
Completed transactions are a separate check.
Around One Sophia, Melvin compared freehold and leasehold alternatives with the new launch and asked what the difference in total price would buy.
Higher asking prices show what sellers are seeking. Completed sales are the evidence for whether buyers paid those prices.
Decision Frameworks, Journey Maker, and Free Tools
For the location comparison, I looked at Sophia Road in relation to the civic district and the downtown core.
Like many modern cities, there is an old-money luxury zone and an ultra-modern zone. In Shanghai it looks the same, with the old-money districts, the ultra-modern business district and the heritage civic area.
I call this the best of both worlds, and it matters for growth.
I also considered nearby education and arts institutions when thinking about who might use the area.
I called it a rare opportunity because en bloc sites are not easy to assemble. Developers need a lot of time to calibrate, and owners have to be willing to move out.
There is also very little Government Land Sales (GLS) in this area.
Buyer profiles, duties and holding power
In the talk I asked how a change in the mix of buyers might affect District 9. If one group faces higher purchase costs, ask who else can and wants to buy at the same price.
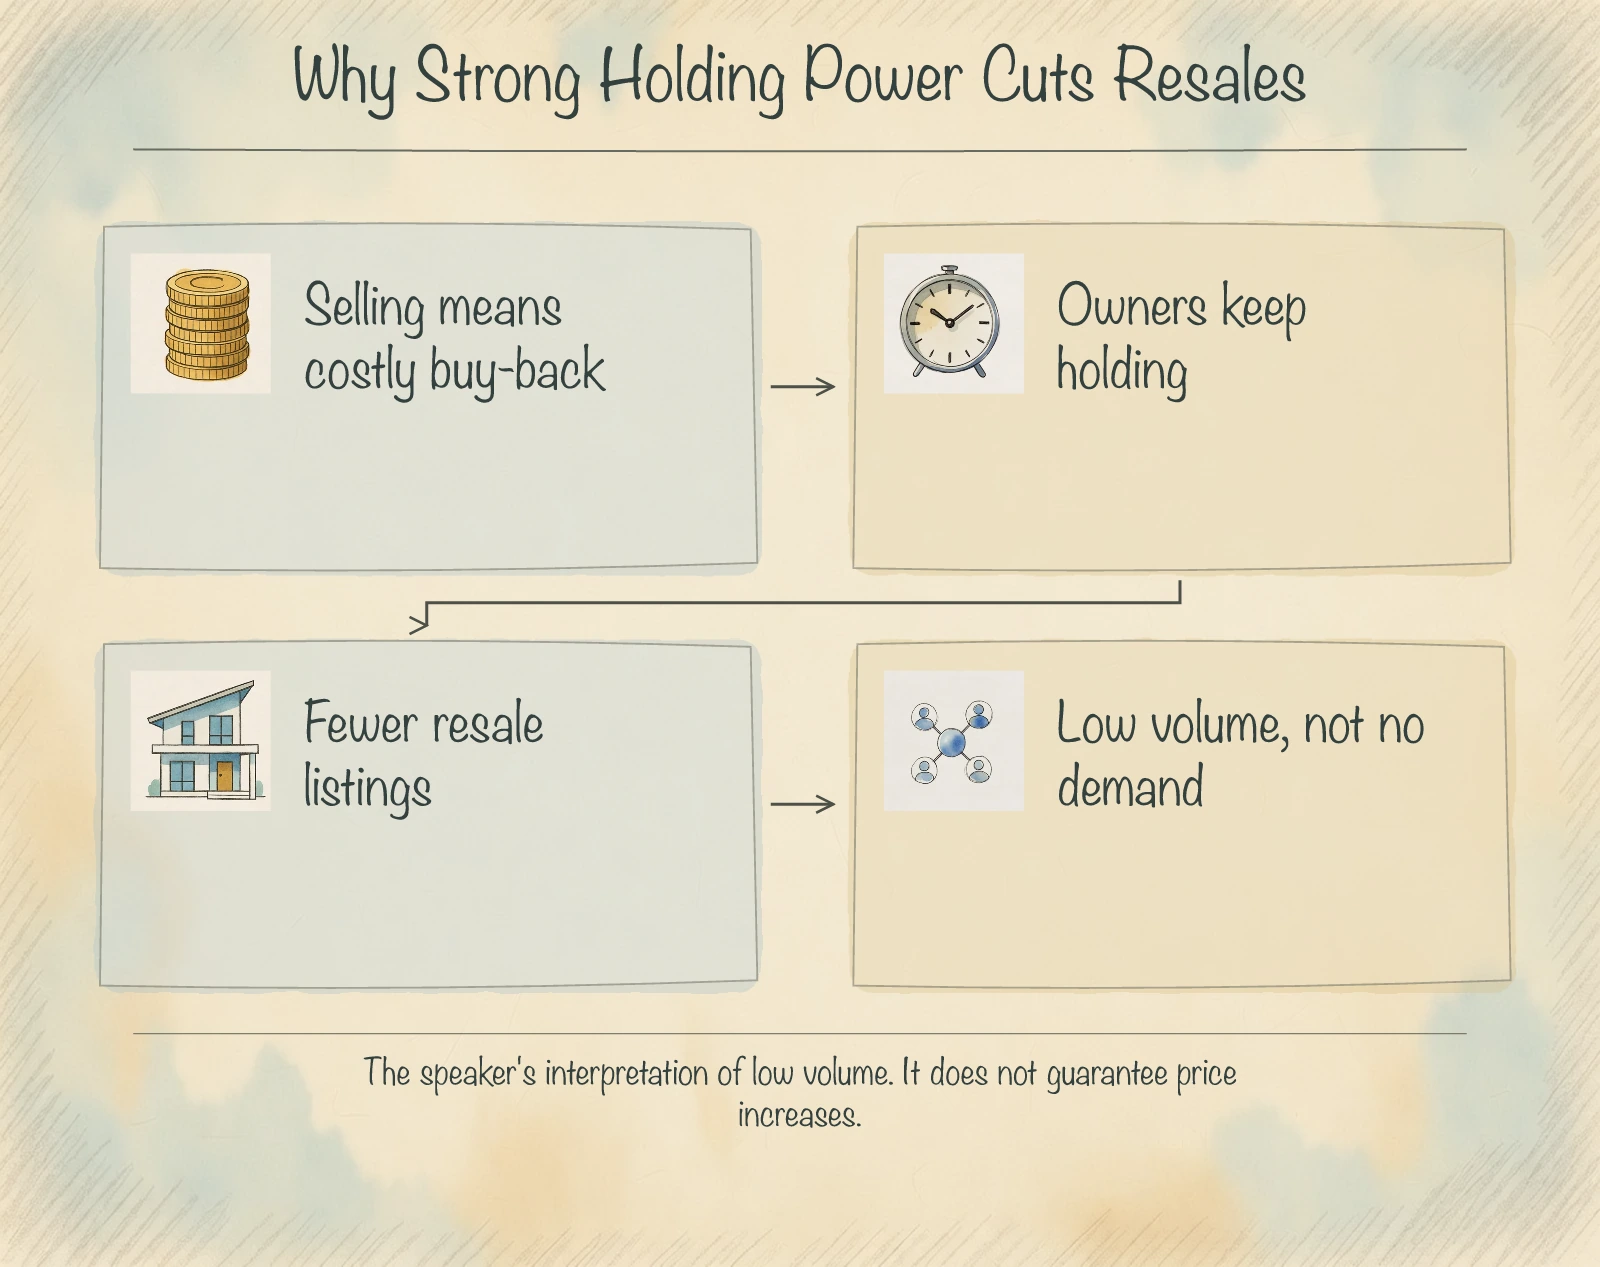
In the talk I raised the possibility that purchase costs affect who chooses to buy and how long some owners choose to hold.
Holding power matters because an owner who can wait has different options from one who needs to sell. The intended holding period is also relevant when comparing transaction costs.
IRAS lists standard residential Additional Buyer’s Stamp Duty rates from 27 April 2023 by buyer profile. For Singapore citizens, the rates are 0% for a first residential property, 20% for a second, and 30% for a third or subsequent property.
For Singapore permanent residents, they are 5%, 30% and 35% respectively. The standard foreign individual rate is 60%.
Most entities pay 65%, with separate rules for housing developers. Applicable reliefs can change the duty.
For residential property acquired from 11 March 2017 through 3 July 2025, IRAS lists Seller’s Stamp Duty at 12%, 8% and 4% in the first, second and third years respectively. No SSD is due under this schedule after three years.
For residential property acquired on or after 4 July 2025, IRAS lists Seller’s Stamp Duty at 16%, 12%, 8% and 4% in the first through fourth years respectively. No SSD is due under this schedule after four years.
The rate applies to the higher of the selling price and market value at disposal.
In the talk I suggested that some owners who can hold may weigh the cost of re-entering the market before deciding whether to sell. The applicable duty depends on the buyer profile and property count.
My argument in the talk was that an owner with the ability to wait might keep a home, rent it out or use it rather than sell and pay the costs of buying again. I saw that as a reason to consider owners’ holding power alongside the number of new buyers.
I also saw cooling measures as a way to discourage short holding periods and speculation.
Comparing a home with an office investment
In the talk, Melvin compared financing for commercial and residential property. The borrowing terms he described were examples from that period.
For Grade A offices, Melvin distinguished the stock that businesses could rent from the units investors could buy. He described buildings held by REITs as one reason the selection available for individual purchase could be smaller than the rental supply.
Melvin used a family office as an example of a potential occupier for a smaller office. He considered whether the address mattered to that occupier, alongside the total purchase price.
IRAS distinguishes residential Additional Buyer’s Stamp Duty and the Seller’s Stamp Duty schedules for residential and industrial property. Office buyers should check the property’s classification and applicable duties, including Buyer’s Stamp Duty.
Those costs are a separate question from how long it will take to find a buyer.
Melvin discussed buying an office with business partners through an investment holding company. He described involving legal and accounting advisers to set up the structure and look at GST.
His ownership question was who would hold the property and whether the space would be used by the operating business or held as an investment.
He distinguished the financing an investment company might seek from the financing an operating company might seek for premises it would occupy. That was a distinction between financing structures in his talk.
It did not establish a loan-to-value ratio or rate for an individual purchase.
Who might buy or rent here?
When I think about who might buy or rent, I look beyond the people already living in the immediate neighbourhood.
In the talk I included people moving to Singapore in my view of who might buy or rent. I also discussed lease terms from a landlord’s perspective.
Those were the demand factors I considered in the talk.
Melvin also considered whether households moving to Singapore might contribute to future demand. From a landlord’s perspective, he included the terms of the tenancy agreement in his assessment of whether a rental investment made sense.
Renter strength and what One Sophia offers a landlord
In the talk, Melvin considered the mix of homes, offices and shops as a possible source of tenant demand. A resident might work in the same development or elsewhere nearby.
The point was to think through who might value that combination.
Melvin considered people working or studying nearby when thinking about demand for rental homes.
Melvin considered the approach from Sophia Road and contrasted it with routes that climb into the surrounding area. He used the route as part of the location comparison, alongside proximity to work, study and transport.
Using frameworks to decide, and doing your own homework
The more important message tonight is that frameworks help us decide better. We have many, but I chose to cover only one, the disparity effect.
If I covered everything it would take about ten hours.
In planning with clients, we calibrate across three scenarios: conservative, stagnation and aggressive. Putting numbers into each case lets you formulate a plan and visualise it, rather than rely on a single hopeful outcome.
What I showed tonight rests on our research team's work and my own experience on the ground. I look at properties every day, and I love property investment and hunting for opportunities.
Use the comparison to decide what you gain for the price, then verify the details before committing.