Evaluating property
Cracking the Condo Code: The First 5 Steps to Assess a Singapore Condo's Investment
Published 2026-11-20. Adapted from the episode published 2023-05-19. Figures, illustrations and data reflect the episode’s original publication date.

On this page
- Starting the Condo Analysis Process
- Project History and Why Volume Isn't Everything
- Unit Count, Transaction Volume and Listings
- Profitable Transactions and Unit Mix
- Unit Concentration, Trends and Condo Community
- Maintenance, Sinking Fund and Herd Mentality
- Groupthink and How Owners Price Properties
- Mode Analysis Examples and Next Episode
Starting the Condo Analysis Process
For today's Nuggets on the go, I'm going to bring you through the top process using two very simple tools, which one performs better in terms of balas curve, quantum effect, MRT effect, exit audience. If let's say you want to analyze a condo or apartment project, let's go.
So for today's episode, we're going to do a lot of screen recording right here on my laptop screen because I'm going to bring you through a very simple top process if you're planning to analyze any properties by yourself.
Let's say if you are in the very initial phase of your purchasing or investment journey, how do you use a quick simple tool like Street Directory as well as Square Foot, which is one of my favorite tools to date.
I've been using it for almost, I think about 10 years already, and I love it from the start to the beginning. Of course, because now Square Foot research is powered by H-Prop, and if you are keen for a subscription,
take note this is not a collab episode, there's no sponsorship from H-Prop. Basically, you just try to review some of the key tools that I've been using for many, many years.
So, I myself have been in the industry for 16 years. This is my 17, no, not 16, 17th year already.
And of course, I've seen the evolvement of tools from the start till now. I started with buying SPH classified newspaper every day because we need to look at the amount of listings published under the property segment.
So back then I started in the era which was 70 years ago using a lot of brick and mortar tools.
We basically depend a lot on calling, we depend a lot on newspaper ads, classified ads, and of course today we have the luxury of having tools right at the comfort of your home and on your mobile as well.
So I'm going to bring you through the top process that I usually adopt. Okay, so I'm going to bring you to my screen.
Usually what I would do
is that if let's say I want to analyze a particular condominium, just go to non-landed residential under transit analysis, click on it, it will bring you to this page, and of course they will showcase, like you know, some of the very trending projects within different districts, and of course you can key right in over here.
So for example, let's say you want to analyze this particular condominium called Covert Melody. Let's go to district 19 just for a bit, and that will bring you out to the main page that's talking about the entire project.
So there's a lot of good tools right here, entire project information. Take note, the first thing that I always look at is that I want to make sure that the time period is all reset to all data.
So that will then bring me to, instead of the last five years by default, I can have accessibility to all the transactions starting from the first day that the property was sold.
So take note, if you are hunting for a condominium project that's 99 years, you want to take note of the 10-0 date rather than the completion date. So there are these two fundamental key differences.
So of course, this episode today is for buyers that are hunting for their first condominium for the first time, or maybe you are in the process of upgrading from a HGP apartment to a condominium, or this is your first time entering into the non-landed residential space.
I think this episode would be fantastic for you. So first thing to note of course is the TANO.
TANO as you can see, 99s from 2004, it means that the land age starts from 2004. If you look at certain advertisements, for example on some of the very common portals, they usually do not put in the TANO start date.
They will actually put in the completion date. Completion date we call it the TOP date in short, and of course in the secondary definition there's also another date called the CSC, which is the statutory completion date.
But by and large,
most people when they talk about completion date, they're talking about the TOP date. That means the date that the first-hand owners got their keys.
Usually from TOP to CSC is about a year or maybe a nine months gap. So we're just defined as a TOP date for today's context.
So basically, the important thing is to look at this because in certain projects, based on the date that the developer actually bidded or owned the land towards the TOP date, that can be a vast difference. Let me give you an example.
If you look at Cocoa Palms, it's a bit different because if you notice, the land is actually from 208 but the completion is from 2018.
We talk about this in one of our episodes under the PRB Insights where we talk about the fact that in the whole Paya Lebar central landscape from Livia all the way to Envy Residences, to D-Nest, to Cocoa Palms, there is actually a history to understand a little bit about why certain projects will launch later, why certain
Project History and Why Volume Isn't Everything
Projects even like, for example, Cocoa Pumps will be launched later but it still performed very well. So we actually talked about that in one of the episodes.
I'm going to put the link right down below. I think that's under our PRB Insights.
We're going to recall which episode is that. Okay, so first thing is to understand about this.
Second thing, let me come back to the cover melody that usually I look at — I want to look at the number of units right here.
So this is a very important aspect to look at, because based on our PRB research, my years of experience looking at so many different properties in totality — right now, I think PRB channel has about 1,900 different episodes, of which about 80% are our home tours.
I personally have filmed more than 1,000 home tours. And with every home tour, usually what we do is that we have a deep dive research.
Let me just show, share a little bit about my listing notes here. So I just came back from, of course, to this filming at number 141 West Coast Green.
And usually the amount of research that we do is basically right here, and we went through a lot of research to look at all the different price comparisons, and then our guys like to do tables like this.
We compare bank valuations, we compare different nodes, and of course we want to look at in terms of comparison, how do we fare in terms of comparative market analysis as well as bank valuations, as well as certain different metrics.
But why is it when we talk about condos and apartments the number of units is important? It's because this translates into the popularity as well as volume.
So in one of our latest webinars, we talked about why volume and popularity is very important. I'm going to flash it right here for you.
So in episode number eight, we talked about why transactions are so important, because transactions equate the popularity and popularity tells us where the demand is. So I'm going to play that probably about 30 seconds, 45 seconds clip so that you can do a quick recap of what that is.
Why do we want to look at transactions? Transactions has already happened, is the past, but why is transaction important?
Because when you see a particular project or particular landed enclave or particular development or particular district with high transactions, we call this high volume. When something has high volume, it means that it has very high popularity.
And without sellers to sell the property, there's no volume, which is no good. But if there's no bias to buy the property, there's also no volume.
So it takes two hands to clap. And what does transactions further tell us?
This also tells us that which area in the district has more demand. And thus, transactions are driven by demand.
But of course, some of you might be asking me, hey, Melvin, is also dependent on supply, because if nobody wants to sell, there's no transactions. True.
That's true. And later I'm going to share with you through a quiz.
But before that, let's look popularity first.
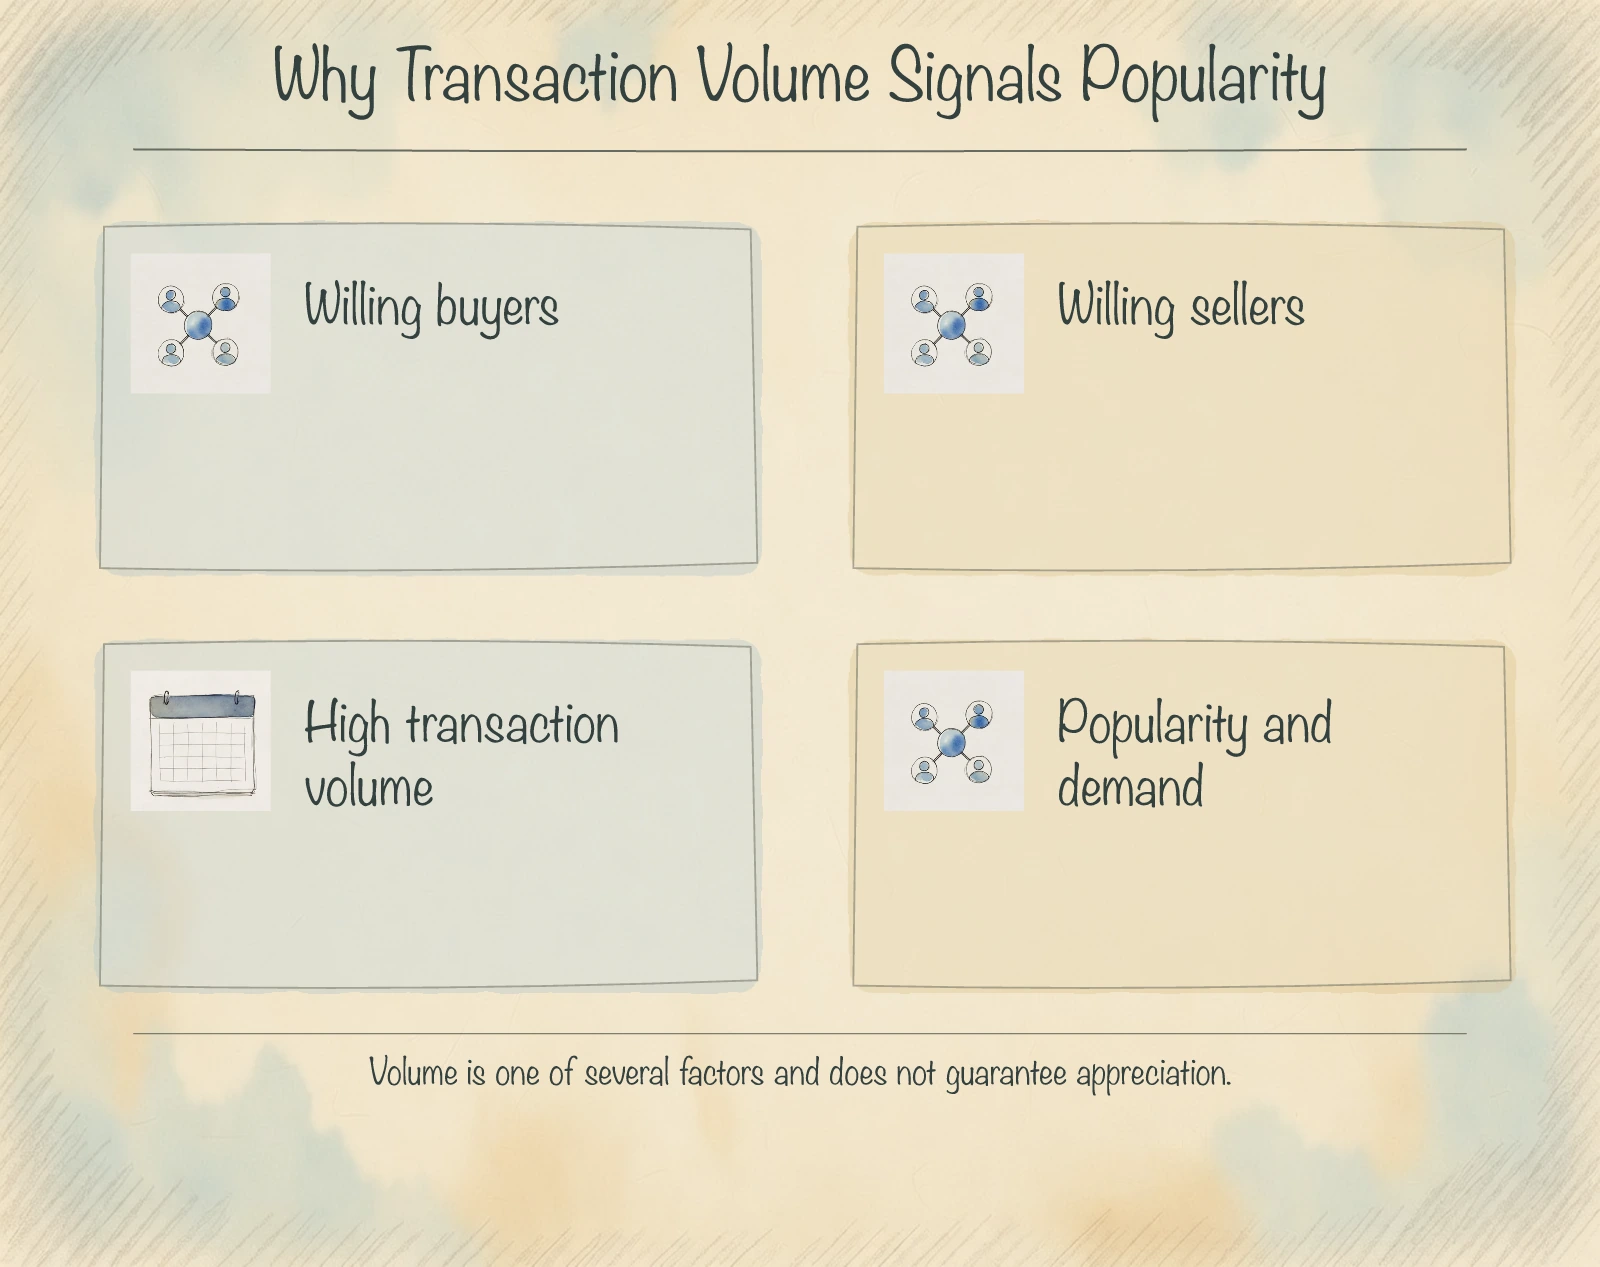
So what can popularity of a project or particular enclave tell us, or a particular district? This tells us that where are people buying?
Popularity also tells us what type of properties people are buying. Are they buying three, four bedders?
Are they buying district nine more or district 10 more? Which particular zoning in the land enclave are they buying?
This tells us what exactly people are buying — is it interterraces, corner terraces, semi-D or detached homes. And we also can get to see where sellers, where are the areas that sellers are willing to sell, because if no sellers are willing to sell, there's also no transactions.
So one key small little side note is that if you notice a place where sellers are willing to sell, the indication is that there has been some form of appreciation. And let me come to that later.
I'll just sum it up for everybody. All right.
Now, the key function is that when I relate back to this particular quadrant here, this particular box right here, and we'll talk about this portion, where sellers are willing to sell. Now, the rationale is because if nobody wants to sell, even if a lot of people want to buy, there are also no transactions.
Okay, so now that we understand why transactions have popularity, the correlation, why is it important that there's demand for a particular project? This helps us to understand why sometimes if you're after sort of a faster appreciation in terms of capital — which of course is not 100% guaranteed because it also depends on so many different factors.
Later I'm going to show you our mode analysis because there's 10 different factors and not just volume. It takes everything, so don't take just one factor as a key punch point, because there's also many many other factors.
Some projects have high number of volume, there's a high density, there's maybe a thousand units or 800 units, but they don't perform as well because there's also so many different things that will govern that or that will affect the performance of the project.
Unit Count, Transaction Volume and Listings
or that will affect the performance of the project.
So this is just one but of course as a general guideline I usually advise that if you are after three, five, eight years of a better chance of seeing a pre-satient in terms of your valuation, try to go for units that are above 300 as a first checklist to take off.
Okay so the next thing is we want to look at the transactions volume in the last six to 12 months. Usually what I do is I'll scroll all the way down and then I will come downwards and there's a very long list.
Ensure that you can see the last maybe 100 transactions. Okay.
And then that will give you a clear idea of maybe in the last six to 12 months, all the way towards April 2022, roughly how many transactions are there. So as you can see over here, you have probably about 20 odd transactions, which means that every month you have at least about two
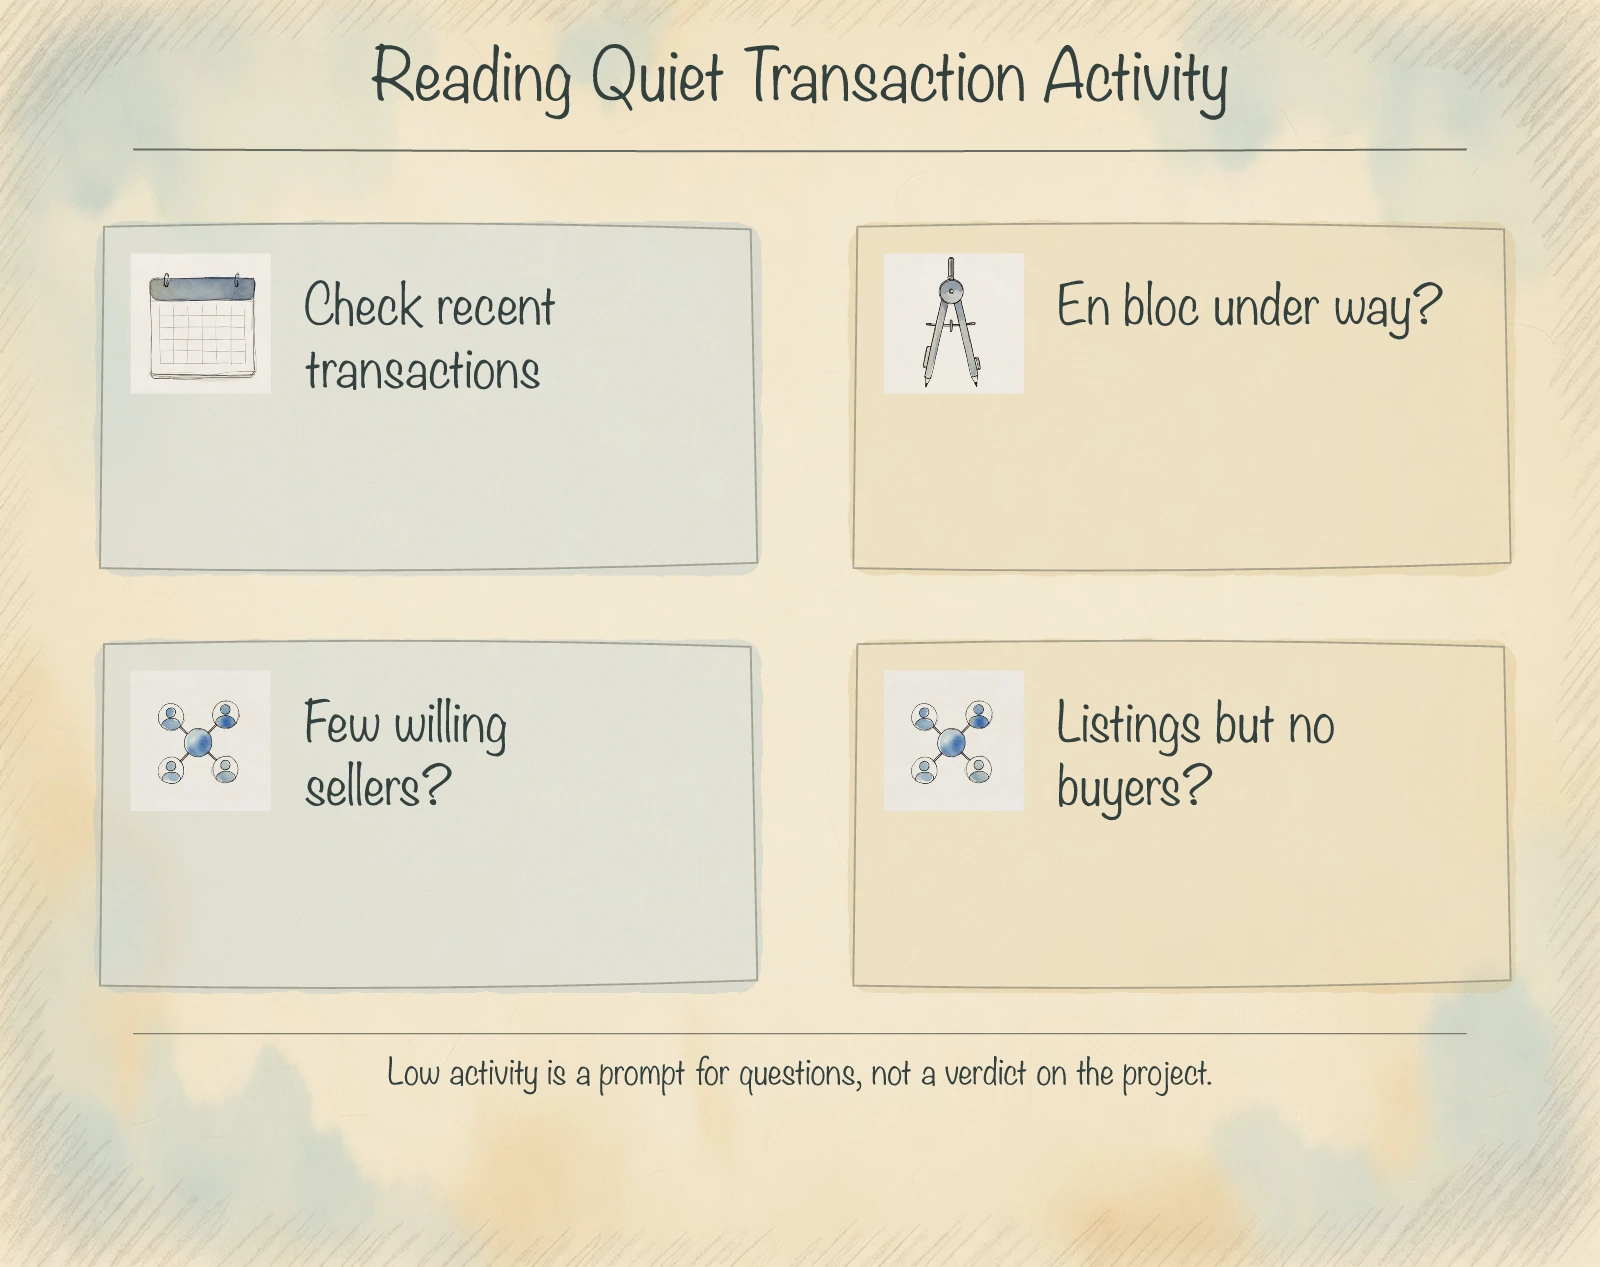
transactions which is seemingly healthy because you don't want to go into a project whereby there are no transactions. If there are no transactions, let's say in a six or 12 months basis, then you need to take a step back and ask yourself that question.
Okay, why is it that there's no transactions? Is it because this project is undergoing an on-block season?
Because take note when the project is going through an on-block phase, the owners and the existing owners right there, they will not put their property in the market because they want to wait for the next 12 to 18 months to see how the on-block evolves, whether there will be a successful tender by developer, whether there will be a successful 80%.
So sometimes when there's no transactions, it means that could be happening. Secondly, if there were to be few transactions that's happening, then you need to also ask, why is it that there are so little people that want to sell?
Or is it
that there's a lot of people that are putting their properties in the market but nobody wants to buy? So the next type of investigation is to go to one of the most popular portals.
So for example, you can go to PropTGuru. Of course, take note that this is not a sponsored episode from PropTGuru as well.
It's just based on our pure recommendation on our top process and what you usually do. Okay, so have a look.
Cover melody, only five listings available. And of course, when you look at the listings, you want to see whether there's any duplicated listings because some owners, they might not sign an exclusive.
So if they are agent, they might have two to three brokers that are selling for them. And of course, when you look at that, then roughly you can see, OK, different agents are listing the property.
And then we can see, OK, there's only five listings. And you can ask yourself, there are 700 over properties right there, of course, spread it into two, three, four betas.
Why is it that there's only five listings? Is it because that the owners feel that the current price point is not worth an exit?
Is it because there are a lot of our owners, even if they sell, they don't know what to buy? Or is it because in the previous round, there are a lot of listings here that's been snapped up?
So things like this. Of course, if you go to maybe another project and you see like a huge amount of listings right here, there are also various reasons.
So for example, if let's say you were to go to part S star you see the hey why is it a part S star there's 160 let me see let me just recap again okay 114 listings here.
Okay so this is because usually for projects that has just hit is TOP stage there's a little bit more motivation for the first hand owners to exit and usually after a project has so-called stabilized for the next few years you will see fewer and fewer listings
So these are just some key market sentiments on the ground. Just in case you're pondering, why is it that some projects are more listing, some projects have lesser listings?
Okay. But by and large, when you look at this on a monthly basis for a matured project like this has already been completed since 2006 until today, it's already close to 16 years after completion.
In terms of land age, it's already 18 years. This is considered quite a healthy transaction.
Now secondly, I also want to look at the chart here. So this chart will tell me a bit more story.
because when I look at this chart, firstly, I will see that it's on an uptrend. Alright, so basically from 2006 until today, you can see that most of the owners at every point that they enter, very likely most of them have seen a profitable transaction and of course you can verify it from here.
So out of the entire history from 2004 until today, that means from the
Profitable Transactions and Unit Mix
From the first time the developers launched the property until today, you have 614 profitable transactions. You can also sort by the profit that people make.
Highest profit is over $1 million. Lowest profit is $2,000.
Take note that this is basically based on entry and exit price. It doesn't take into consideration the buyer's stamp duty, the bank interest, the property tax they pay along the years and things like that.
But by and large, very easy to do a mental calculation is that BSD is average between 3% to 4%.
Seller, when you exit, you need to pay about 2% agency fee, and then of course adding in maybe the legal fees and stuff like that, you just take entry and exit as a 6% costing without calculating MCST, property tax and of course the bank interest.
Why do I recommend — not say recommend, why do I not take this into consideration? Because for example, the reason why you have bank interest is because you chose to leverage, because somebody that is paying full cash, they have no bank interest.
So just for
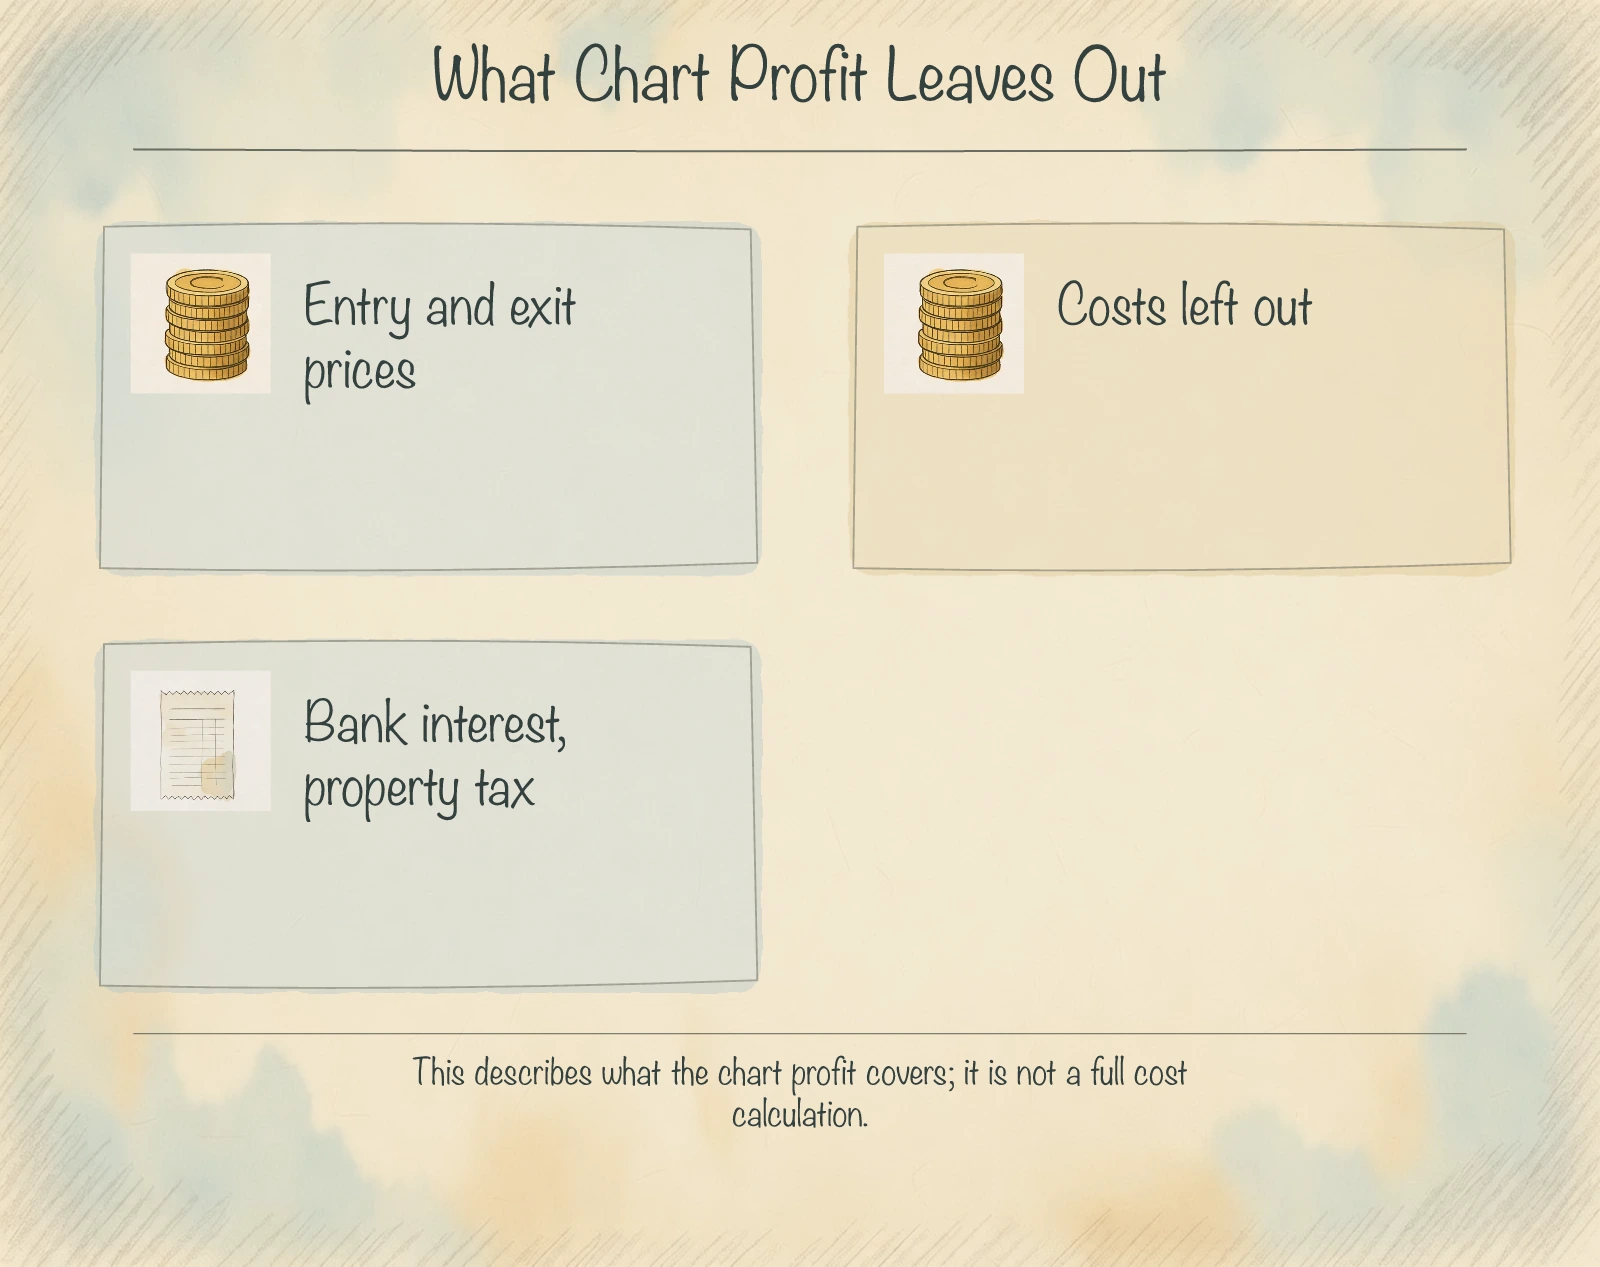
calculation sake, in terms of entry and exit costing, usually we take 3-4% entry, 2% exit. All right.
And why is it that we don't take MCST into consideration, we don't take property tax into consideration? Because everybody has to pay them.
MCST is because you pay to contribute to the sinking fund and you want to enjoy the facilities. Property tax, everybody has to pay, even if you're staying in an HDB, landed or condo, you have to pay.
So just to calculate this, for simple calculation reasons, entry-exit is about 6%. So when you look at this, there's also 13 unprofitable transactions.
Why is that happening? And of course, you want to see when did they buy and when did they exit.
Now, of course, when we talk about this line chart, then of course, it's high time that we take out the cooling measures chart as well. So I like to go to the cooling measures chart because with that, you can have a little bit more so-called insights
to look at. Why is it that certain projects, they perform in certain behaviour?
We talk about that a lot in many of our series, but as a quick glimpse, cooling measures came in after 2009. The heaviest round was in 2013 because ABSD and TDSR came in.
And after 2013, developers started to launch smaller and smaller units, right? Now, The Calrose was actually launched in this era, 2004 to 2006.
So this was the previous era. So you still get pretty sizeable 3-bedders right there, because if you look at the size of the units over here, usually you can also look at this breakdown over here, which is one of my favourites as well.
So I like to come here. I like to look at this.
Basically, you can see the two-bedders are between 8 to 900 square feet, which was true to the fact that before 2013, a lot of the units are created in a bigger fashion. And of course, you also have like two plus study, 104 square feet.
So if you want to verify, you can just quickly Google The Calrose. But this is, if you have no subscription or anything, just Google The Calrose floor plans and then try to verify in terms of the sizing.
Of course, you get to see a lot of different portals right here. Very simply, I like to go to this website which is also not owned or affiliated with us.
So you can get to see 2-bedders and roughly you can get to see, okay, the 2-bedders are about 83 square feet — 947 square feet, which is the large version of a 2-bedder. It's not even a 2 plus study.
And then of course you have 893 square feet. There's a home shelter and closed kitchen, wide angle.
Oh my goodness, look at this. Wide-angle living dining, fantastic layout, rooms are huge, and of course if you go to the 3-bedders, they are generally huge in nature.
Now these 3-bedders are about 900 plus to 1000 square feet,
1281 square feet is the 4-bedder size today in 2023 in new launches, and usually when you look at this, then you can move on and then you can see okay, how big is the 3-plus-study, there about 1444, 2 square feet, and then you try to get a sensing of how big are the 4-bedders, is about 1,765 square feet.
That will then bring us back to The Calrose square foot. So then we can have a nice understanding right here that based on this, you can also of course come to have a look at this website.
So have a look at the project information in terms of specification. So usually when you come to this page, this will give you a very good sensing.
Okay, two-bedders 91 units, three-bedders 188, four-bedders 190, is quite well spread. Something to just take note is that in certain projects when there is an overpopulation in terms of a particular type of unit, for example
Unit Concentration, Trends and Condo Community
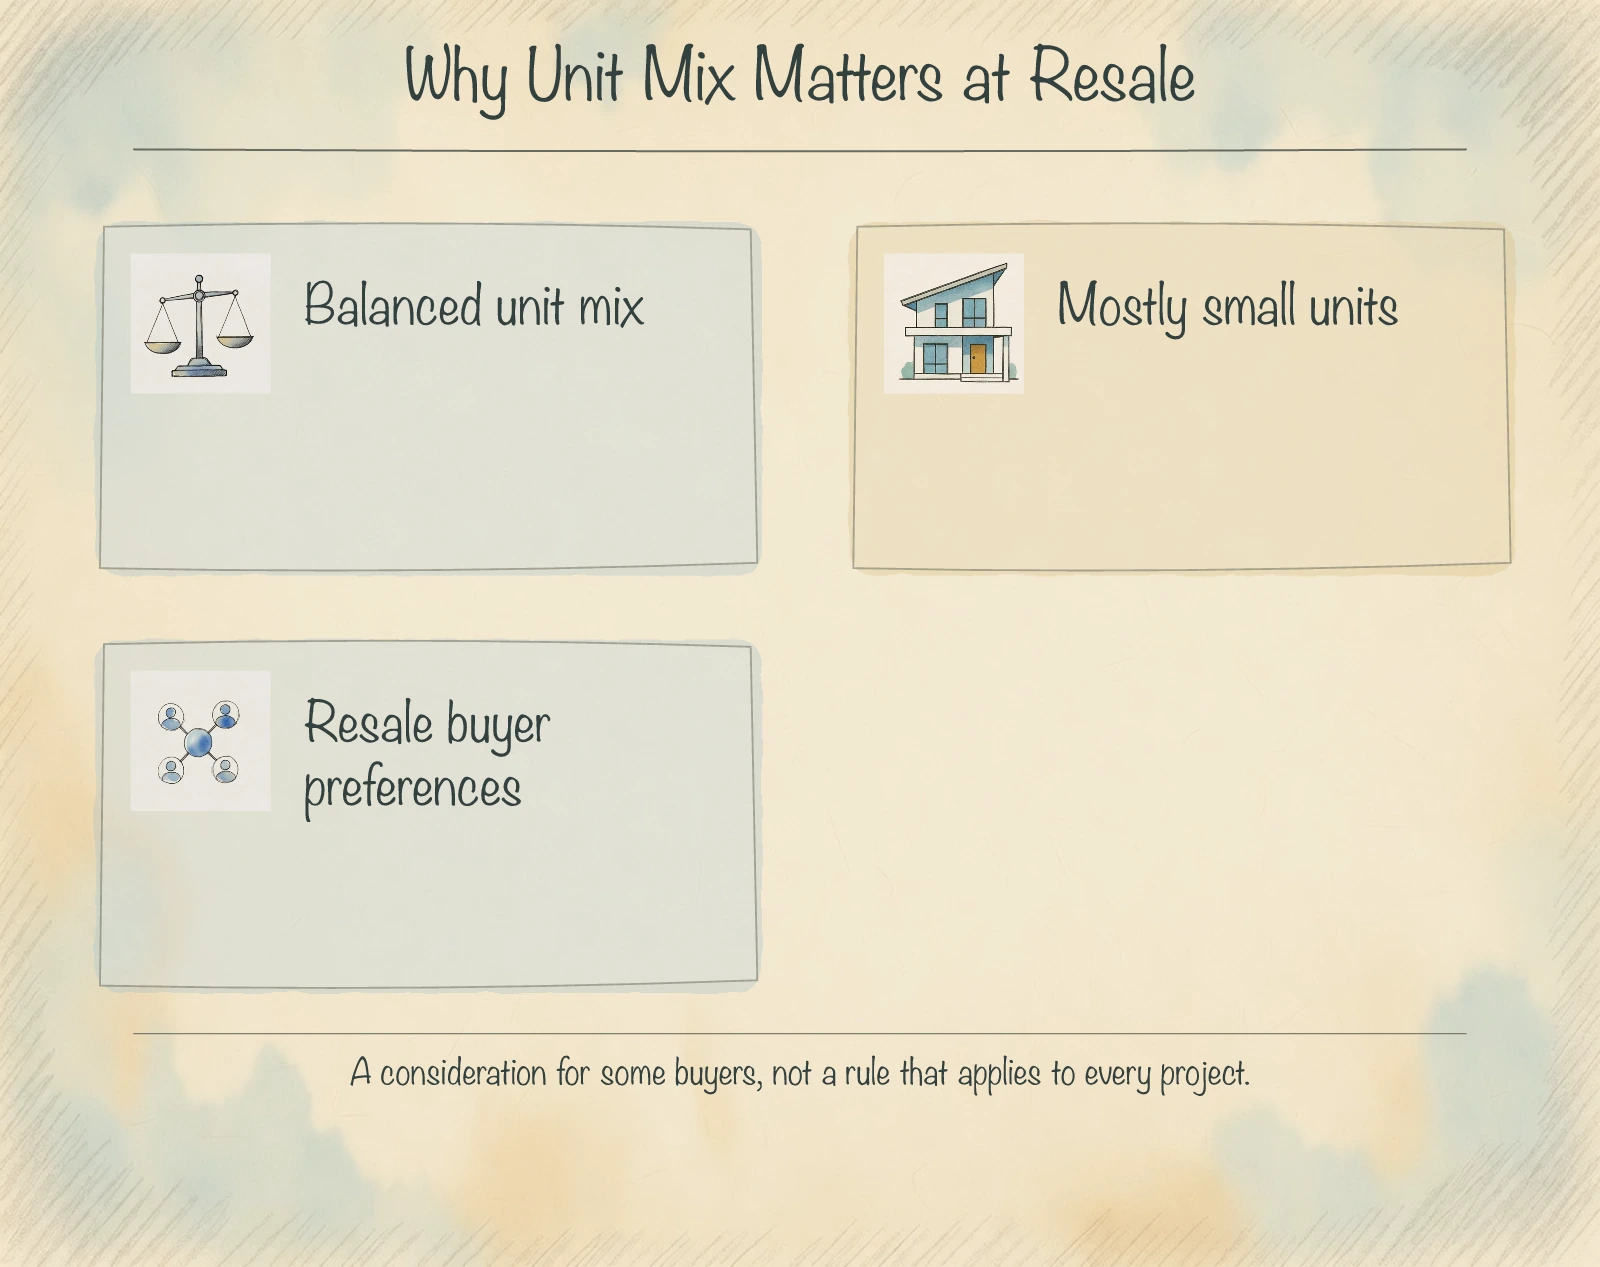
Let's say you see this project with 800 units, but 400 units belong to the smallest version, the 1 and 2 bedders, and then maybe 3 bedders there's only like 100 units, 4 bedders like 100 units. Then you need to see the spread.
Now, sometimes if there is too much concentration of small units, this affects the behaviour when you want to exit in the resale market.
Because for example, maybe certain buyers are hunting for certain projects that have more families, and they do not want to have too much of the units being tenanted out because they want to live in maybe an environment that they are more home owners.
And sometimes certain projects that have more density in terms of 1 bedders or maybe 2 bedders, they tend to be rented out more, especially if they are located in the RCR zoning, very near the MRT, very, very tenant centric.
Then when it comes to home buyers that want to buy for own stay, maybe that will be one of their consideration points.
Over the years, certain things have already evolved. In the past, this concern, which is not prevalent right now in my context, is that in the past, sometimes people will think that hey, if a project has a lot of smaller units, the smaller units tend to accommodate a higher PSF, bigger units lower PSF.
Now in the last three years, we have seen this phenomenon not present anymore because the bigger units have already caught up with the smaller units in terms of PSF. Now if you look at a lot of projects right now, just for example, these two and three bedders, let's come back to CoalMalady.
If you look at their performance, you look at 904 square feet, transacted at 1449 PSF, and that was in March 2023. 123, 12 finite square feet, the 3 bedder also transacted about 1437 PSF.
But in the past, it was very different. What was different is that in the past, usually there is like, it can go up to about $100 over $2 per square foot.
Just have a look at this transaction here. 904 square feet, a 2 bedder was doing at 995 PSF, but you would not be able to get that for a 3 bedder because like, averagely you can see 3 bedder in about the same type period doing at about $100 less or even $190 less per square foot.
And that's what I meant in the past, but in recent years, especially after the pandemic has shifted the attention to bigger units. A lot of people are preferring larger units because they work from home, stay at home, study from home.
A lot of home businesses are taking place. This is just a shift in terms of demographics behaviour, something that we have to take into consideration as well.
The bigger units now have matched up in terms of PSF level, and in fact now a lot of things are shifting towards the big units, a ready interest of popularity and demand. So this is just something for you to take note and that's one thing I look into consideration as well.
Now the next thing is that I want to see after knowing that how many people have made profitable transactions, then this is where the dilemma sets in because from a consumer point of view you might be thinking two things.
Number one, this project is performing well. Will it continue to perform well in the next five, eight, ten years when I want to sell, or will the graph be tapering downwards?
Okay. Second thing is that you might also think, hey, by buying this project, am I helping the first few owners to make profits?
Because I will be the one that's entering and they will be enjoying the profit. So that is usually something that will go through the buyer's mind.
There could also be a third thing that could be going through a buyer's mind is that should I go for a project that is like downwards in terms of its performance so that I can catch it at the bottom and so that it has a chance to re-turn back up.
So usually that is probably the
two to three things that will go through a person's mind when you want to buy a project like this now. Let me show you my perspective.
Yes, I've seen projects that have done the U-turn, but in our analysis that usually takes a long, long time to happen. Later, I'm going to show probably one project just to end of this episode.
Now, the reason is because there's a certain set of behaviours that happens in a condominium development. Okay, firstly, to explain the phenomenon, let me give you the quick summary first.
The quick summary is that projects that tend to go on up here tend to have a higher chance to continue the uptrend. Why is that so?
Now it has a lot to do with the project itself because take note we're not talking about a singular project. We're talking about a community.
Now a condominium is a community. When you buy into a strata development you're buying into a community.
Why? Because the very fact that you need to contribute
Maintenance, Sinking Fund and Herd Mentality
Two sets of money every month into your MCST already tells you you are buying into a community. So firstly, you pay for maintenance fee.
Alright? Secondly, you pay for something called a sinking fund.
Sinking fund is used when let's say after seven or eight years, your condo calls for a tender from painters to repaint the exterior of the project; they will use and tap into a sinking fund. When your lift needs to go for a major upgrading, they tap into the sinking fund.
And sometimes when there's not enough sinking fund, they call for additional funds for all the owners. Everybody may contribute $1,000 and pay into that sinking fund, so that you can do work together.
Now, this is of course the community fund. So in short, sinking fund is called community fund.
So when you buy into a strata development, firstly take note, you're not owning the land. You're owning the airspace occupying the land.
And everybody that occupies a strata unit in the airspace, they own the land technically together for that 99 years or maybe for that freehold period. That is the reason why when you buy in the strata condominium or apartment, you're buying firstly into the rights of your airspace as well as you're buying into this community.
That's why everybody that owns an airspace can come down to utilize the common usage and the pool, the gym and everything, the clubhouse and all that kind of stuff, right?
Now that we know that okay this is sort of like buying into the community, let's move on to the second point. The very fact that you are buying into this community with seven seven eight units and you're one of the owners here, that means you have 777 other neighbors that also own this community together.
There is this new thing that will then evolve. I call it the herd mentality.
Herd mentality happens on two fronts.
Number one, when everybody buys into the project when it was launched by the developer at the show flat and let's say from year 2004 until 2005 and now we can then easily track back to the transactions; you just need to go down here and look at this new sale and when did the new sale end up.
So new sale will end around here. Okay the last new sale concludes in 2007.
That means there were some balance units because perhaps 2006 there was like a subprime crisis. So it took a little bit long to sell off this project and I remember Colvin Melody and maybe Colvin Residences back then they probably had like two launch phases.
I need to recall my memory but I remember very clearly Colvin Residences has two launch phases because there was a subprime crisis back then in US and things were a little bit wonky in a global fashion.
So it took a little bit to sell but first of all the owners that bought that time, to have a look at how much PSF it was back then, it's only like five six hundred dollars per square foot.
Okay so now when you look at this it means that this project sold out between 2004 to 2007 and all these owners that bought back then, they all bought it at about $500 per square foot to $600 per square foot.
It's quite consistent and when you buy into that together, what's going to happen is that you would think the same way. Why is that so?
It's because just imagine now, you bought into a brand new project here in today's day and age and let's say you bought it at $2,000 per square foot in the year 2020, with the rest of the 700 odd buyers that bought at the show flat at the same time.
And you waited 3 years for this project to complete.
What's going to happen is that when you take your keys 3 years later, you open the door, you go into your unit, you bought at $2,000 per square foot, what are the chances that after waiting for 3 years in the year 2026, somebody walks up to you and says that hey, I understand you bought this property at 3 years ago, 2023, $2,000 per square foot.
Can you sell me today 2026 at $2,000 per square foot? Now what would you say?
Would you sell it? The high chance is that likely you won't because maybe you have bought a unit for stay.
You don't want to sell. You will either just rent it out or you will move in.
You have waited 3 years because maybe these 3 years you are staying with your in-laws or maybe at your parents place or you've been renting. Finally, you got a chance to move in this brand new project.
You won't stay. And the gist and the crux of the herd mentality is that you will not be the only owner to think like this.
All the 700 owners will be thinking like this and they will be having the same mentality. Maybe their mindset is that I bought at $2,000 per square foot.
I will only sell if somebody offered me $2,000 3 to $2,000 4 per square foot. I want to see
Groupthink and How Owners Price Properties
At least a $400 PSF gain. Then I will part with my key.
If not, there's no motivation for me to sell because I'm doing okay. I still am running my business.
I'm having my job, we're doing income, my kids are happy here. I don't want to sell.
So this is the first herd mentality that happens in a project series through time. The first one is that during the launch phase to the key collection phase, there's this first round of herd mentality.
We call it a groupthink, G-R-O-U-P T-H-I-N-K, a groupthink will happen here. And then moving on, the groupthink will actually stretch.
What do I mean by this? Now take note, when you look at this graph, some of the owners that have been staying there from day one, they still have not sold yet, and they have been staying there since 206 until today, for the last 17 years.
They have bought at $5 to $600 per square foot. A 3-bedder back then cost them only about $7,000 to $800,000.
Now they can sell a 3-bedder for maybe about $1.8 million dollars if you've seen the asking price just now. So they bought at about 800,000, they can exit at 1.8, they are sitting on a profit margin of $1 million.
There's no need for them to panic sell. They can take equity arrangement for the bank to extract the value and the capital.
If they want to sell because they want to move to a next home, a bigger home, or a landed property, or they want to downsize, that wait 15 months to pay off HGP, they can easily do that. And that could be one of the reasons why COVID-19 has only five listings.
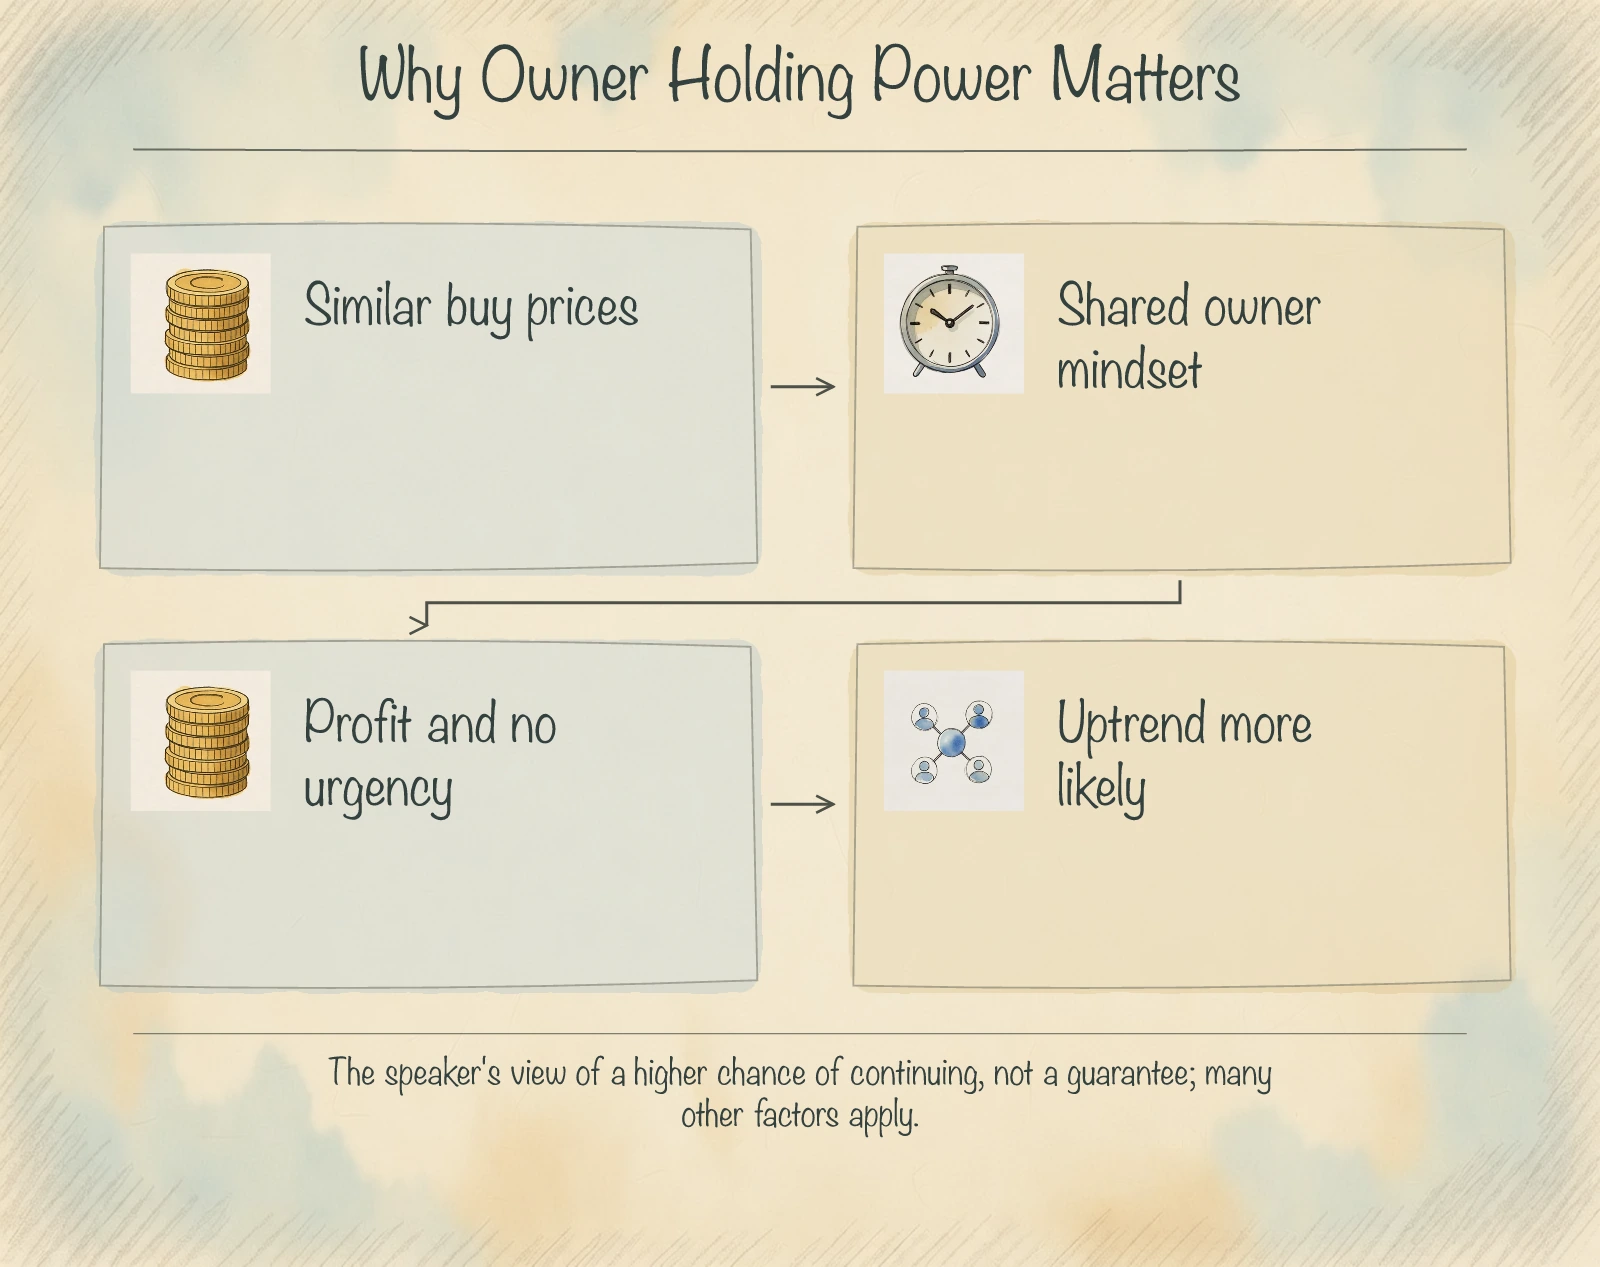
And because of this, the chances of this project going on the uptrend is even more. Why?
It's because the holding power of the existing group of owners that have not exited, or people that have bought it maybe in 2010 at 700 plus per square foot, bought it at 2012 at 103 per square foot, and today is averagely about $1,400 to $1,500 per square foot.
And take note, every time as an existing owner, if let's say you were to be somebody that is owning a property in CovertMalady, you see that the last transaction is at 1471 PSF, and you look at what is available now in the market, let's say you go back to PropertyGrow, you're trying CovertMalady.
The mindset of the existing owner is that I don't want to sell lower than my past neighbour. That is also the reason why there are owners that are calling for 1480 or maybe even 1680 or 1526 PSF, and that is one of the call rationale.
Because the fresh new owners that want to put a property in the market, they will reference to a few key data points: bank value, how much did my neighbours sell previously, what are the people that are putting their property in the market now asking for.
I take these three things combined, bank valuation plus transaction and asking price of other people now.
Then I form a decision that now if I want to put my property in the market, if I'm high, low floor, facing the road, or facing the pool, or facing the landed facing, and my renovation is sunk in, my next one that I want to buy, I take all these things combined and I form a decision on how much I want to price my property.
So usually by understanding this, then it gives us a little bit more insights on how the existing owners are thinking. Then it helps us to make a nice viewpoint of collaborating all this top process to analyse a project together.
So all this explanation actually came from that question of will a project that is performing like this continue to perform better, or is it better for me to hunt for projects that are going downtrend and buy at the bottom?
Now, firstly, to summarise, a project doing like this to continue the uptrend is much higher because the existing owners are sitting on a higher profit margin and there's no urgency for them to sell.
Now secondly, a project that is going downtrend, sometimes it takes a longer period for them to hit a per 2, and when all other neighbouring projects have already escalated to a higher level, then they will start to do an upturn.
It's sometimes a little bit difficult to hunt for that bottom, it might still go down a little more because maybe some of the owners have already waited for a very long time and they are tired already.
There are projects everywhere that perform in uptrend and downtrend and there's no clear-cut rule of which district have more of such low-performing projects or which districts have higher-performing projects.
And that's the reason why we developed Mode Analysis, because with Mode Analysis, this is our PRB in-house Condo Mode Analysis, where we have a proprietary system, we fresh feed all the URA of entire condos and apartment projects into our system and that allows us to rank it.
So for example, if I want to rank [project], I can do it. I want to maybe look at the project behind, beside them, [project], I can do it.
Mode Analysis Examples and Next Episode
And then I want to maybe also rank Coven Regency because I'm thinking about these three projects they're all near to Kovan Marty station, I punch in the numbers, that gives me the results on a little bit more insights.
But let's have a look at this, look at some examples here.
This is a property at Newton, it's on a downtrend, this is a property at D19, it's on a pletuing stage, this is a property at D11, pletue for the last nine years, This is a project in D23, when downtrend, U-turning up slightly after a good 9 years as well.
And then of course this is in D9, downtrend, it has not U-turned yet. So basically in summary, not all projects will see appreciation in 3, 5, 8 years.
Sometimes it takes 10, 15, 20 years. And what are some of the key fundamental things that we need to take note of is that we need to use a combination of tools nowadays.
So for example, Mode Analysis is just one of the two.
It helps us to see in terms of ranking, which one performs better in terms of Barlas Curve or Quantum Effect, MRT Effect, Exit Audiences and stuff like that. And of course, we love to do it because this is our bread and butter.
We live and breathe it every day. We look at all these charts every day.
And for today's episode, we hope that I've added value to you in terms of just sharing some of the top processes based on some economics data on a micro basis. And I'm going to cover this series of analysis of projects.
I'm going to analyze real projects together with you
on a 10 series approach and then we can analyze some of the key fundamental behaviors behind some of these graphs, charts and behaviors over time. In the meantime, take care.
Bye. Record with sound.
Boom. in...
Okay, sorry for the long time.